Know your TA.
Each indicator does one job. What it tells you, when to use it, and when it is lying to you.
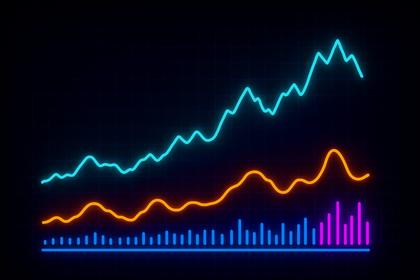
ATR (Average True Range) in Crypto
ATR measures how much price is moving on average, giving you a read on current volatility. It helps traders set smarter stops, size positions properly
Read it →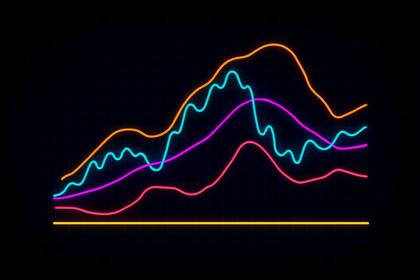
Bollinger Bands Explained for Crypto
Bollinger Bands show when volatility is tightening, expanding, or losing momentum. Tight bands often signal compression before a move, while widening
Read it →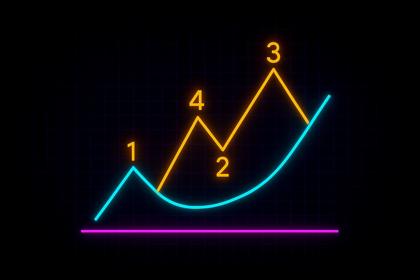
Elliott Wave Theory Explained
Elliott Wave Theory helps you read whether a market is expanding, correcting, or nearing exhaustion. Its real value is not perfect wave counts, but un
Read it →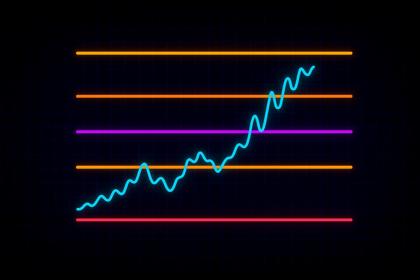
Fibonacci Retracement Explained
Fibonacci Retracement helps identify where a pullback may pause, hold, or fail within a larger trend. Its levels matter most when price action, volume
Read it →
Ichimoku Cloud Explained for Crypto
Ichimoku shows whether price, momentum, and trend structure are aligned or out of sync. The cloud helps reveal when the market is balanced, trending,
Read it →
Moving Averages Explained for Crypto
Moving averages help filter out noise and show whether price is trending, consolidating, or starting to weaken. Their real value comes from the slope
Read it →
Relative Vigor Index (RVI) Explained
RVI helps you judge whether momentum is steady and consistent, not just fast. Its crossovers and slope show whether a move is gaining conviction or st
Read it →
Stochastic Oscillator Explained
The Stochastic Oscillator shows whether momentum is still supporting price near the edges of its recent range. It is most useful for spotting slowing
Read it →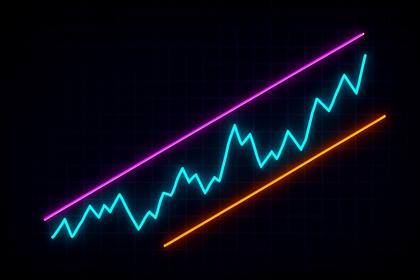
Trendlines Explained for Crypto
Trendlines help reveal whether market pressure is still being respected or starting to fail. Their real value comes from the reaction around the line
Read it →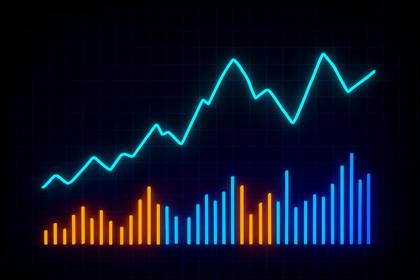
Volume Patterns in Crypto Explained
Volume patterns show whether price moves are backed by real participation or just drifting on weak conviction. Rising volume often confirms strength,
Read it →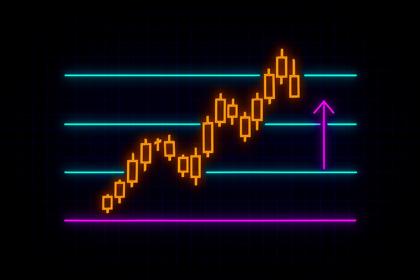
What Are Pivot Points in Trading
Pivot Points map likely support and resistance zones before the session begins. They help traders read reversal, continuation, or exhaustion through p
Read it →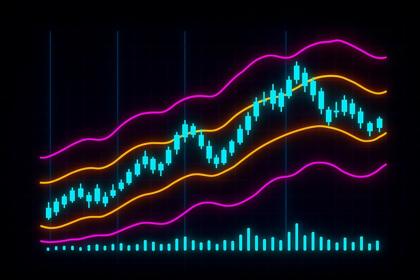
What Is VWAP in Crypto Trading
VWAP shows the session’s true average traded price by weighting price with volume. It helps traders see whether price is trading above or below real v
Read it →
What Is the MACD Indicator
MACD helps reveal whether momentum is building, fading, or starting to shift before price fully reacts. Its lines and histogram show if a trend still
Read it →
What Is the RSI Indicator
RSI shows whether a move still has momentum behind it, not just whether price is rising or falling. High or low RSI matters most when it aligns with s
Read it →Nothing in that category yet.