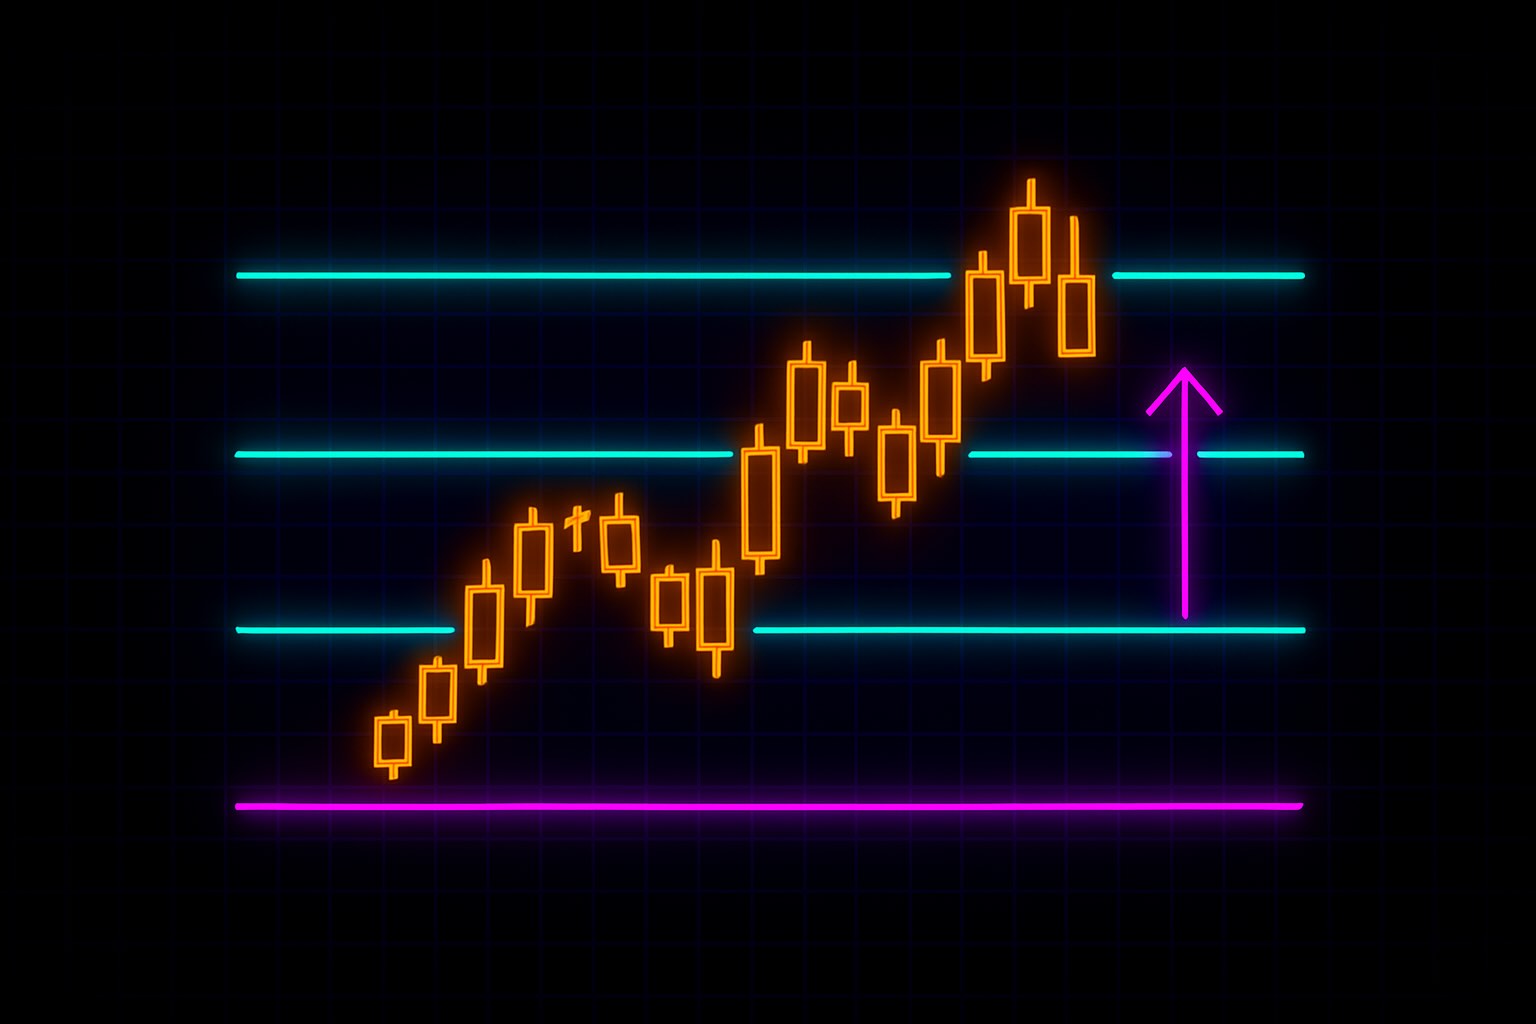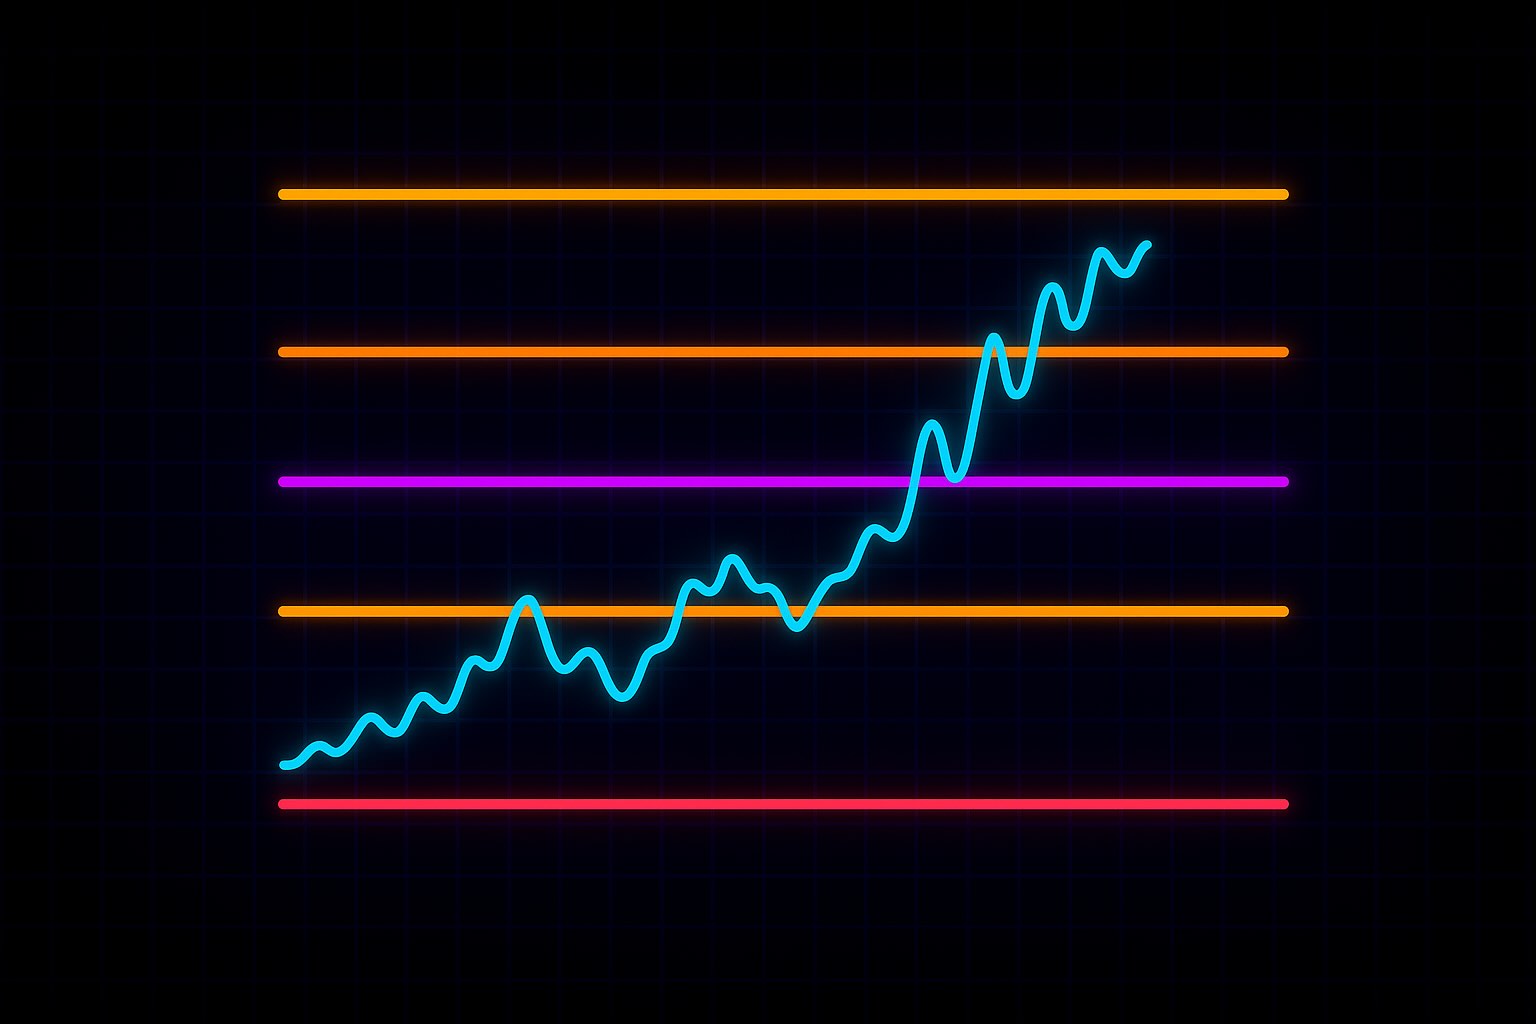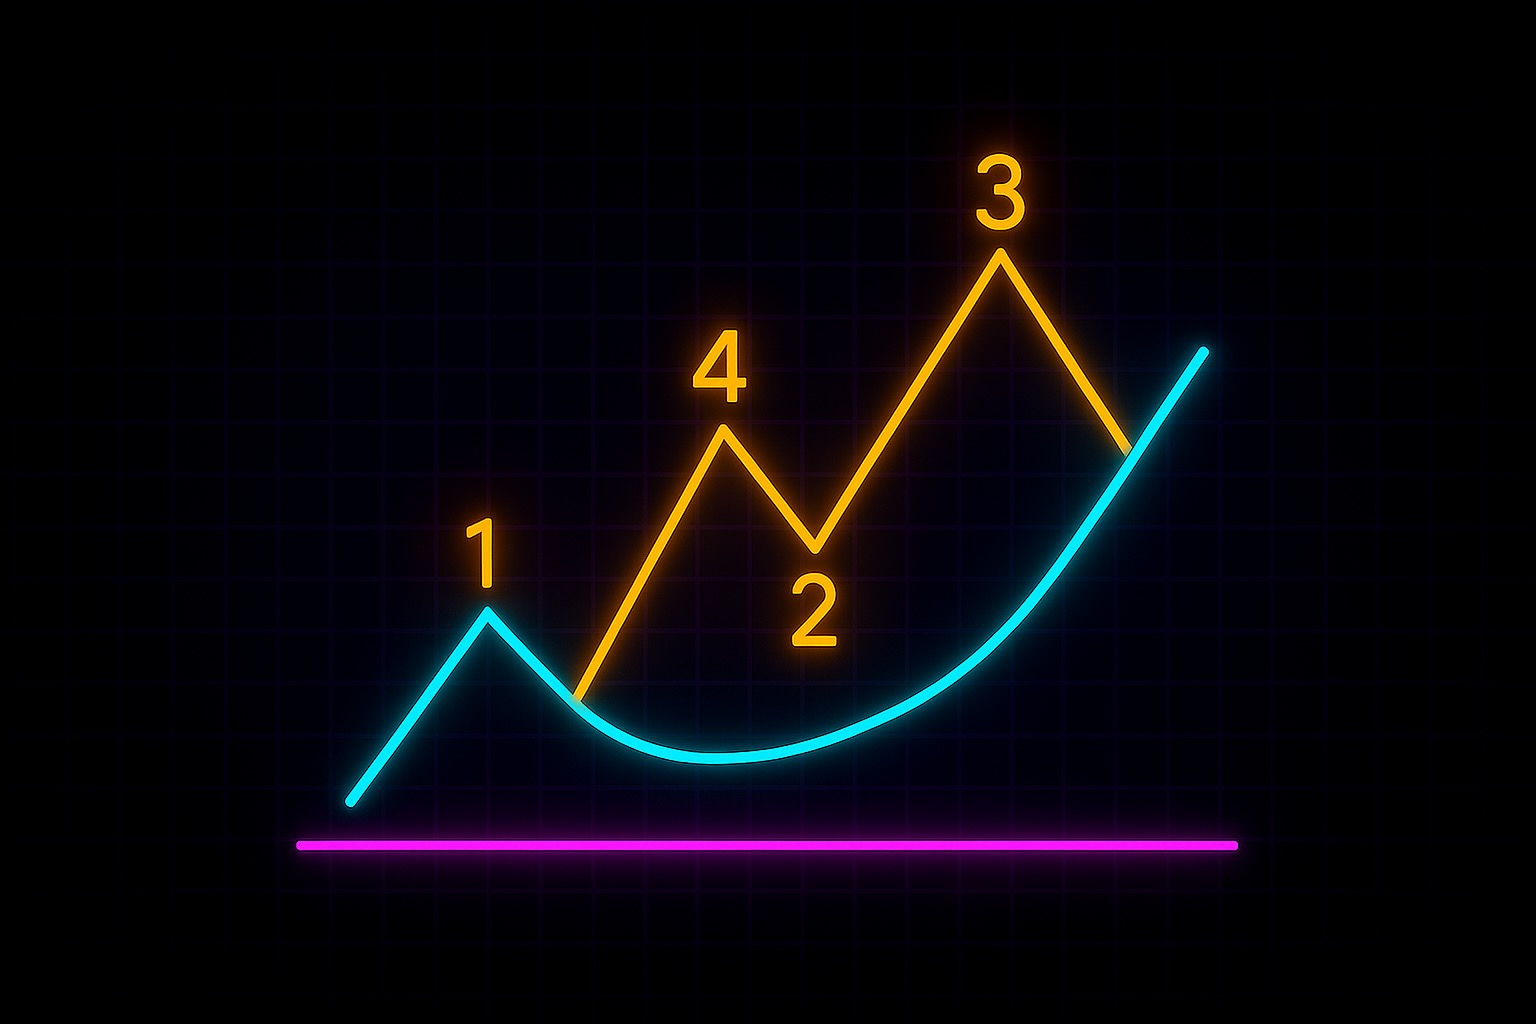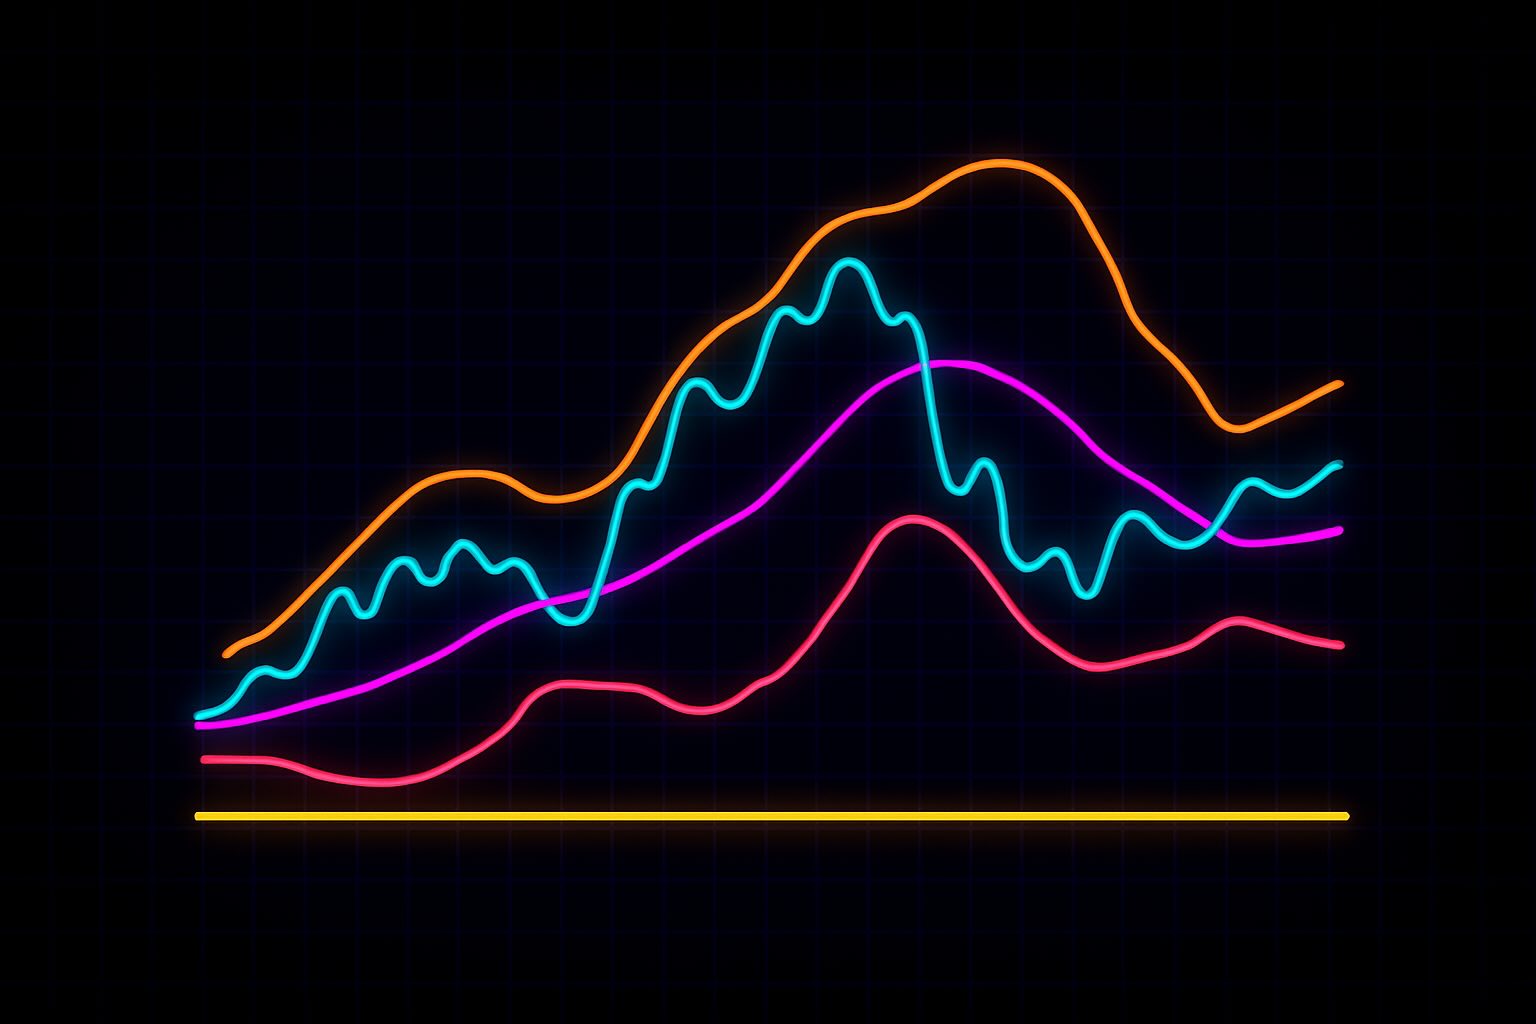
- RSI shows whether a move still has momentum behind it, not just whether price is rising or falling.
- High or low RSI matters most when it aligns with structure, divergence, and trend context.
- The real edge is using RSI to confirm strength or spot fading momentum before price fully reacts.
Welcome to this Kodex walkthrough:
RSI — How to Spot Momentum That Matters
Price can rise even when strength is fading.
That’s why momentum matters — and why RSI helps you look beneath the surface.
In this walkthrough, you’ll learn what RSI is, how it works, and how to use it to spot when a move is strong — or running out of fuel.
You’ll see how RSI helps confirm breakouts, reveal early signs of weakness, and keep you from chasing moves with no real backing.
Because strong moves leave strong footprints.
And momentum tells you if they’re still worth following.
Let’s begin.
What It Is — and Why It Matters
Momentum often fades before price does. That’s what makes tools like the Relative Strength Index (RSI) valuable. RSI helps you track whether a move is accelerating, losing steam, or likely to reverse — not based on price alone, but on the strength behind it.
RSI is a momentum oscillator. It measures how strong recent gains are compared to recent losses, and plots that strength on a scale from 0 to 100. When RSI is high, it means recent buying has outpaced selling. When it’s low, selling pressure dominates.
The key insight: extreme strength often leads to exhaustion, and extreme weakness often leads to rebalancing.
RSI doesn’t tell you where price will go.
It helps you see whether the current move is still supported by momentum — or if it's running out of fuel.
Used with structure, it becomes more than a signal.
It becomes a way to understand what’s driving the move — and whether that force is holding.
The Levels — And What They Show You
RSI moves on a fixed scale — from 0 to 100.
But most of the useful action happens between 30 and 70. These thresholds help you understand whether the market is showing strength, weakness, or balance.
Here’s how Ava reads them:
- Above 70 — This is traditionally considered overbought. It means buyers have been in control, but it doesn’t mean price will reverse immediately. Instead, Ava watches for slowing momentum, divergence, or hesitation. If structure confirms, she may prepare for a pullback or pause — not a blind short.
- Below 30 — Considered oversold. Sellers have dominated, and exhaustion may be setting in. But Ava doesn’t assume a bounce. She looks for signs of defense — higher lows, slowing candles, or volume shifting — before trusting the reaction.
- Between 40–60 — This is the neutral zone. If RSI stays in this range, the market is often consolidating or resetting. It tells Ava the move has no clear momentum edge — and may not be worth engaging.
- RSI trends — In strong bull trends, RSI may stay above 40–50 without dropping to oversold. In bear trends, it may stay below 60. Ava pays attention to where RSI spends most of its time — not just where it spikes.
- Divergence — One of RSI’s most useful traits. If price makes a new high but RSI does not, Ava notes potential bearish divergence — momentum is not confirming the move. The same logic applies in reverse for bullish divergence.
RSI doesn’t lead price — it reflects the strength behind it.
And when that strength begins to fade, structure often follows.
When to Use RSI
Ava uses RSI when she wants to understand the energy behind a move — not just where price is, but whether it’s accelerating or weakening.
RSI is most useful when:
- A trend is already in motion, and she wants to know if it’s gaining or losing strength
- Price is approaching a key support or resistance zone, and she needs confirmation or caution
- She’s watching for signs of exhaustion, divergence, or hidden momentum
It’s especially effective when:
- Combined with structure — such as a bounce off support with RSI climbing
- Used to spot divergence between price and momentum
- Filtering breakout entries — Ava looks for RSI to support the move, not contradict it
But RSI loses value when:
- It’s used alone as an entry or exit trigger
- Price is choppy and moving sideways — where RSI naturally oscillates without meaning
- The trader assumes “overbought” means “short now,” or “oversold” means “buy now” — without context
RSI is not a signal by itself.
It’s a way to measure participation — how committed buyers or sellers really are.
When price and momentum agree, Ava gains confidence.
When they diverge, she pauses — and looks closer.
A Guided Walkthrough: Ava Reads the RSI
Let’s follow Ava as she analyzes a possible trade on Solana (SOL) after a strong run.
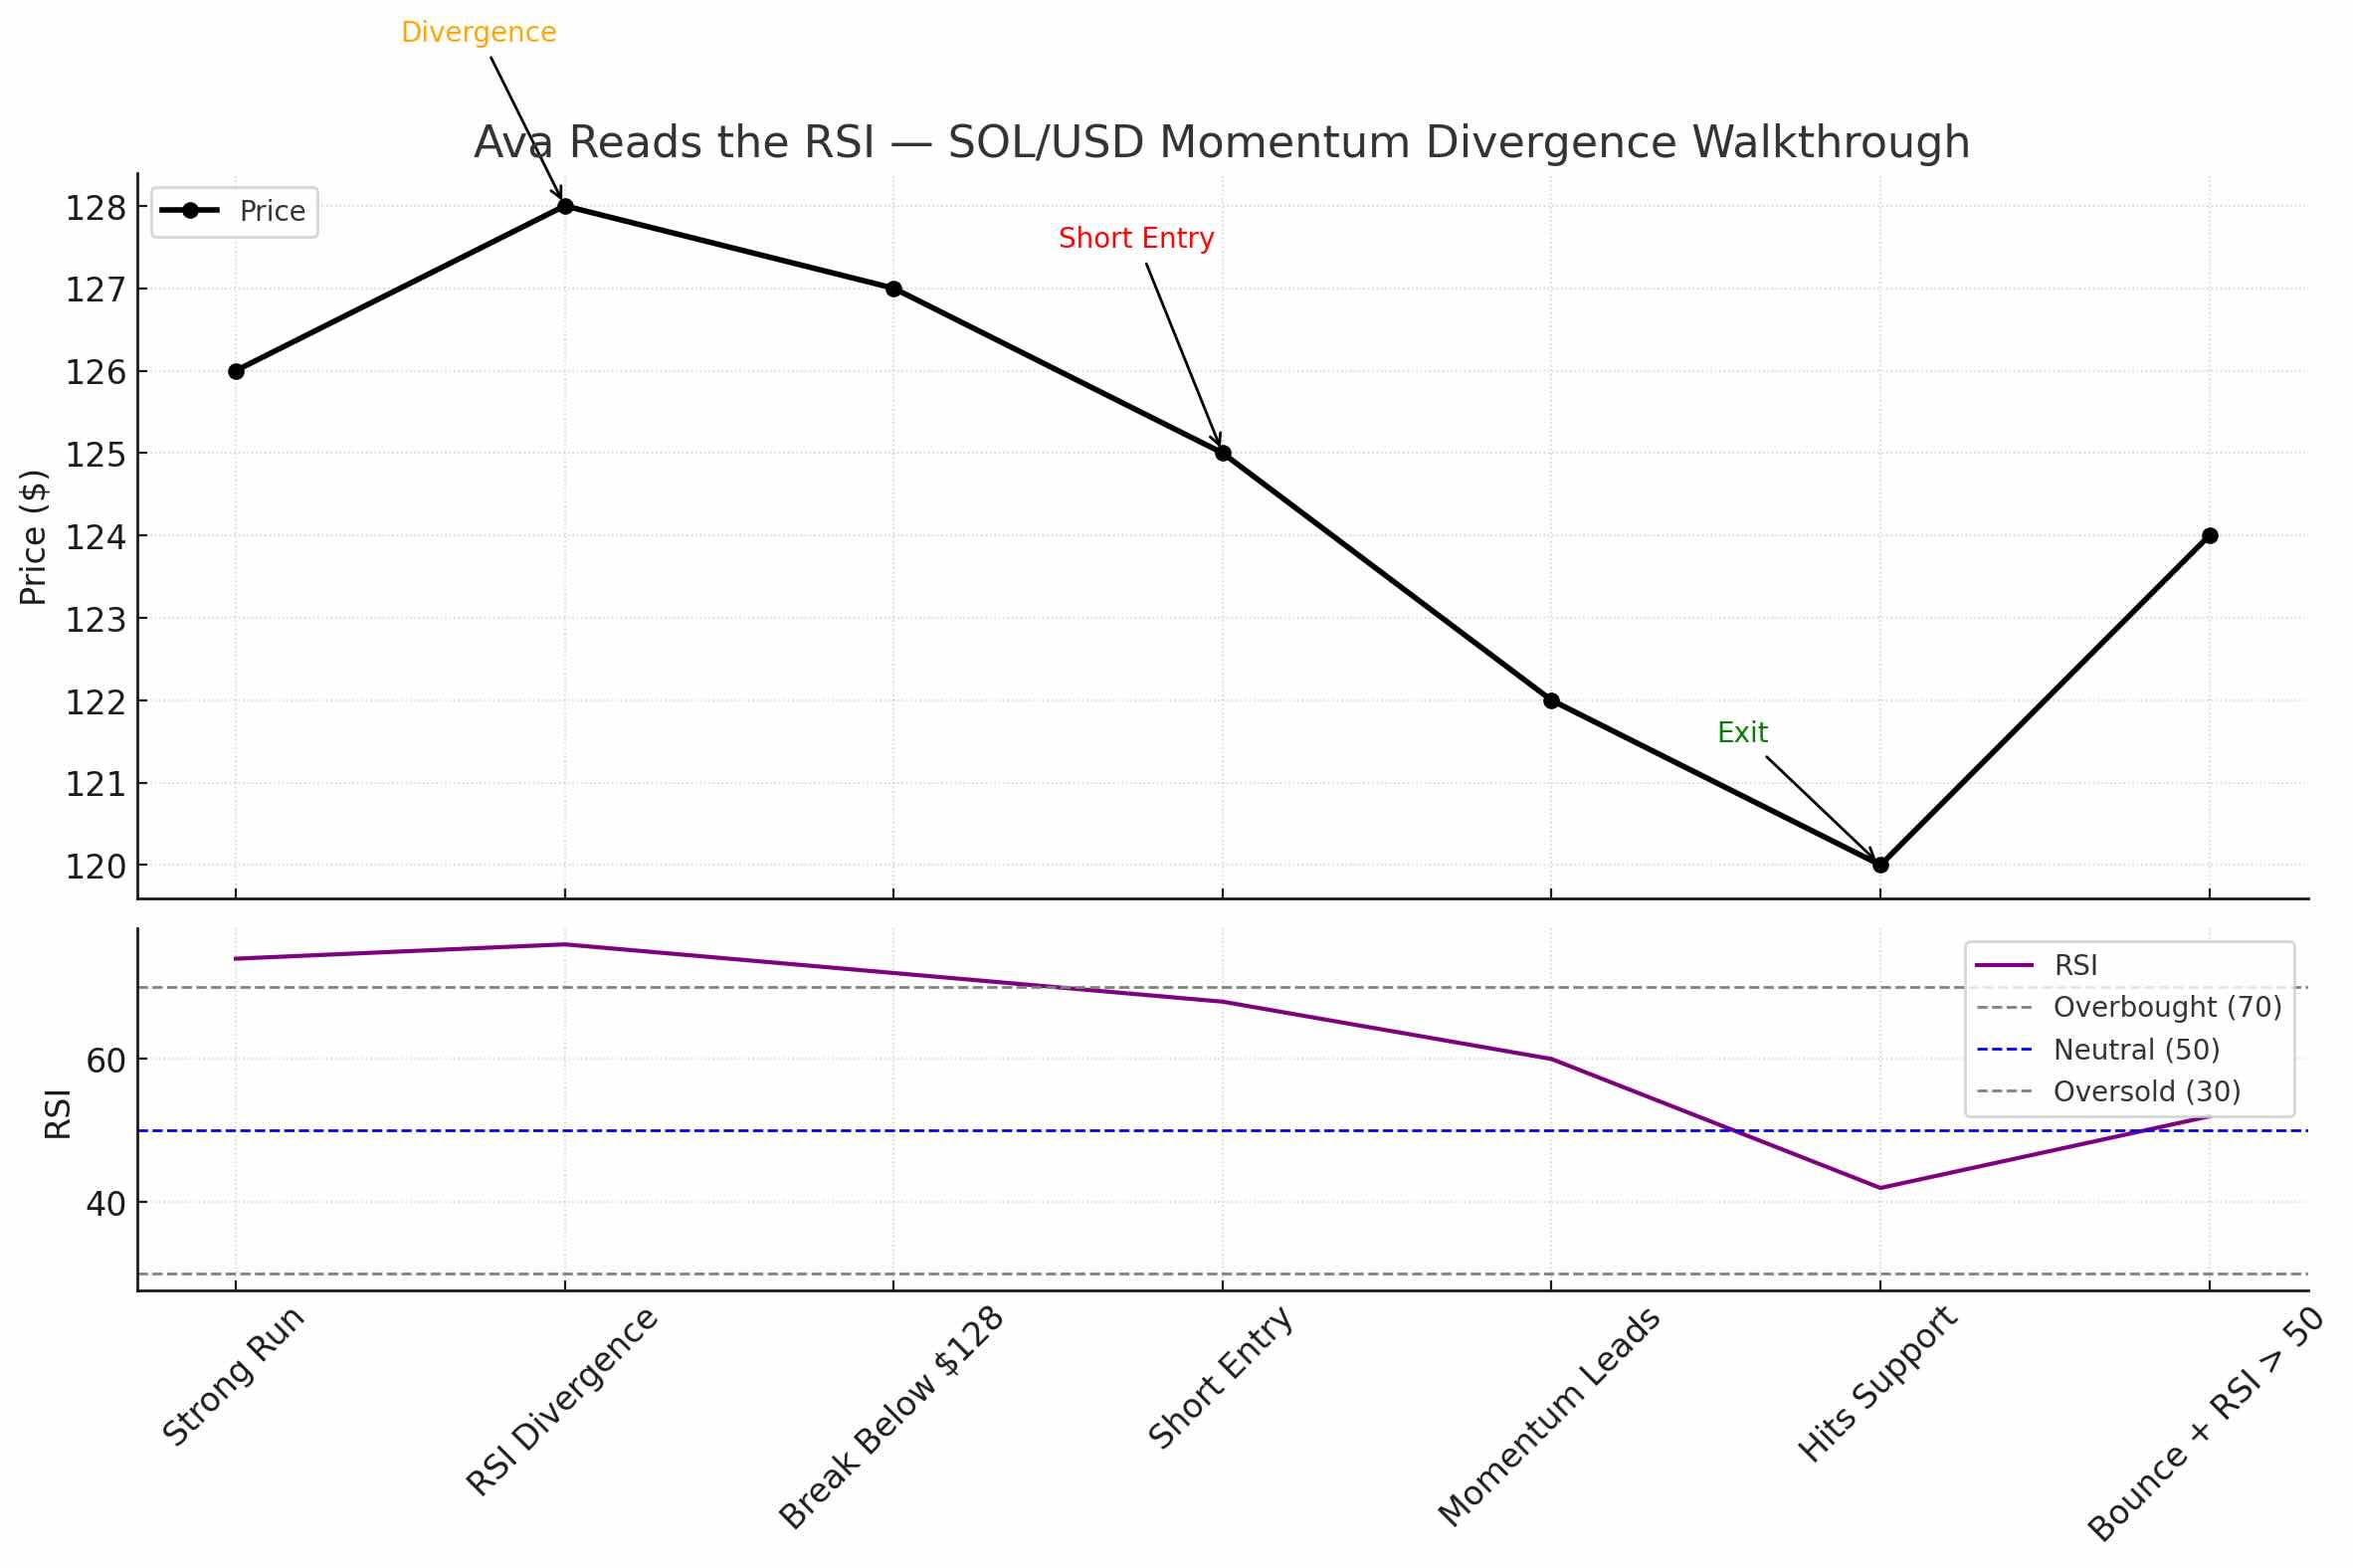
Price has rallied from $110 to $128 over the last several sessions. The trend looks strong, but Ava doesn’t want to chase. She checks RSI on the 4-hour chart.
It reads 76 — above the 70 threshold. That tells her buyers have been in control, but now she shifts her focus. She's not looking for a reversal. She’s watching for signs of fatigue.
She notes that price is pushing to new highs, but RSI is not. The most recent high in price isn’t matched by a new high in RSI. That’s bearish divergence — a sign momentum may be weakening, even as price climbs.
She doesn’t enter yet. She waits for structure.
A few candles later, SOL fails to hold $128. A lower high forms. RSI dips back below 70 — still elevated, but now showing hesitation.
That’s Ava’s cue.
She enters short with a stop-loss above the recent high and a target near the breakout base around $120 — a logical zone of support.
As the trade develops, RSI continues to fall, even before price does. Momentum is leading the turn. Ava exits as price hits support and RSI approaches 40 — momentum has reset.
She didn’t trade because RSI was high.
She traded because momentum shifted — and structure confirmed it.
Later in the week, SOL bounces again — but this time, RSI climbs above 50 before price breaks out.
Now momentum and price agree.
This time, Ava prepares for a long.
How to Read the Reaction
RSI doesn’t tell you what price will do next.
It tells you whether the strength behind the move is supporting it — or not.
Ava doesn’t react to RSI levels alone. She observes how momentum and price behave together.
Here’s what she looks for:
- Is RSI rising with price — or lagging behind it?
If both move together, the trend is supported. If price pushes higher but RSI stalls or falls, it signals a loss of momentum — a warning, not a trade by itself. - Are RSI reversals sharp or slow?
A sudden drop in RSI while price stalls often points to a shift in participation — momentum is leaving before price reflects it. - Does RSI pull back to the 40–50 zone and hold?
In uptrends, that range often acts as momentum support. If RSI bounces there, Ava considers the trend healthy. If it breaks below, she looks for weakness in structure too. - Are divergences happening at key levels?
If price is testing resistance but RSI is making lower highs, she watches for a possible failure. If RSI confirms the breakout with a new high, she has more confidence in the move. - Is RSI flattening during consolidation?
That tells Ava momentum has paused — not reversed. It’s a signal to wait, not to fade the trend.
For Ava, RSI isn’t a signal.
It’s a layer of context — one that only matters when it supports what price is already starting to show.
Ava’s Mental Model — Her Process with RSI
Ava doesn’t use RSI to time trades.
She uses it to measure momentum alignment — and decide whether a setup is worth taking.
Each session, she starts by scanning RSI on the 4H and daily chart.
Is it elevated? Depressed? Neutral? That first glance helps her define whether the market has energy behind it — or if it’s cooling off.
If RSI is above 70, she doesn’t short immediately. She watches. She looks for signs of slowing — divergence, rejection candles, or flattening structure. If RSI drops back under 70 and structure supports it, she prepares to act.
If RSI is below 30, she’s cautious about entering short. But she also won’t buy blindly. She needs a reason — volume shift, structural defense, or confirmation that the selling has lost power.
In strong trends, Ava expects RSI to stay elevated.
In healthy pullbacks, she watches for RSI to hold the 40–50 zone.
Momentum has its own structure — and she treats it the same way she treats price.
She also watches for divergence — especially when it appears near key support or resistance. But she doesn’t act on divergence alone. She waits for confirmation from price before committing.
For Ava, RSI is never a trigger.
It’s a filter — helping her avoid weak trades and focus only on moves backed by strength.
Kodex Perspective
RSI is not about finding tops or bottoms.
It’s about understanding what’s driving the move — and whether that pressure is holding.
It helps you measure momentum. But momentum alone isn’t enough.
At Kodex, we pair it with structure, confirmation, and context.
We don’t trade because RSI is overbought.
We trade when price and momentum agree, and structure supports the setup.
When RSI aligns with behavior — it builds confidence.
When it diverges — it tells us to pause and observe.
RSI is a tool for measuring strength, not predicting direction.
Used well, it helps you stay out of weak setups, wait for confirmation, and act only when energy is present.
Let RSI reflect the intent.
Let structure confirm the plan.
And let alignment — not emotion — guide the trade.
Pull up a chart in the Kodex simulator and lay RSI over it. Find the moment Ava waits for: price stretching to a fresh high while RSI quietly prints a lower one. Mark that divergence, hold until structure cracks before taking the short, and watch momentum turn down ahead of price. The balance is simulated, so what you are really testing is whether you can trust fading strength over a rising price.