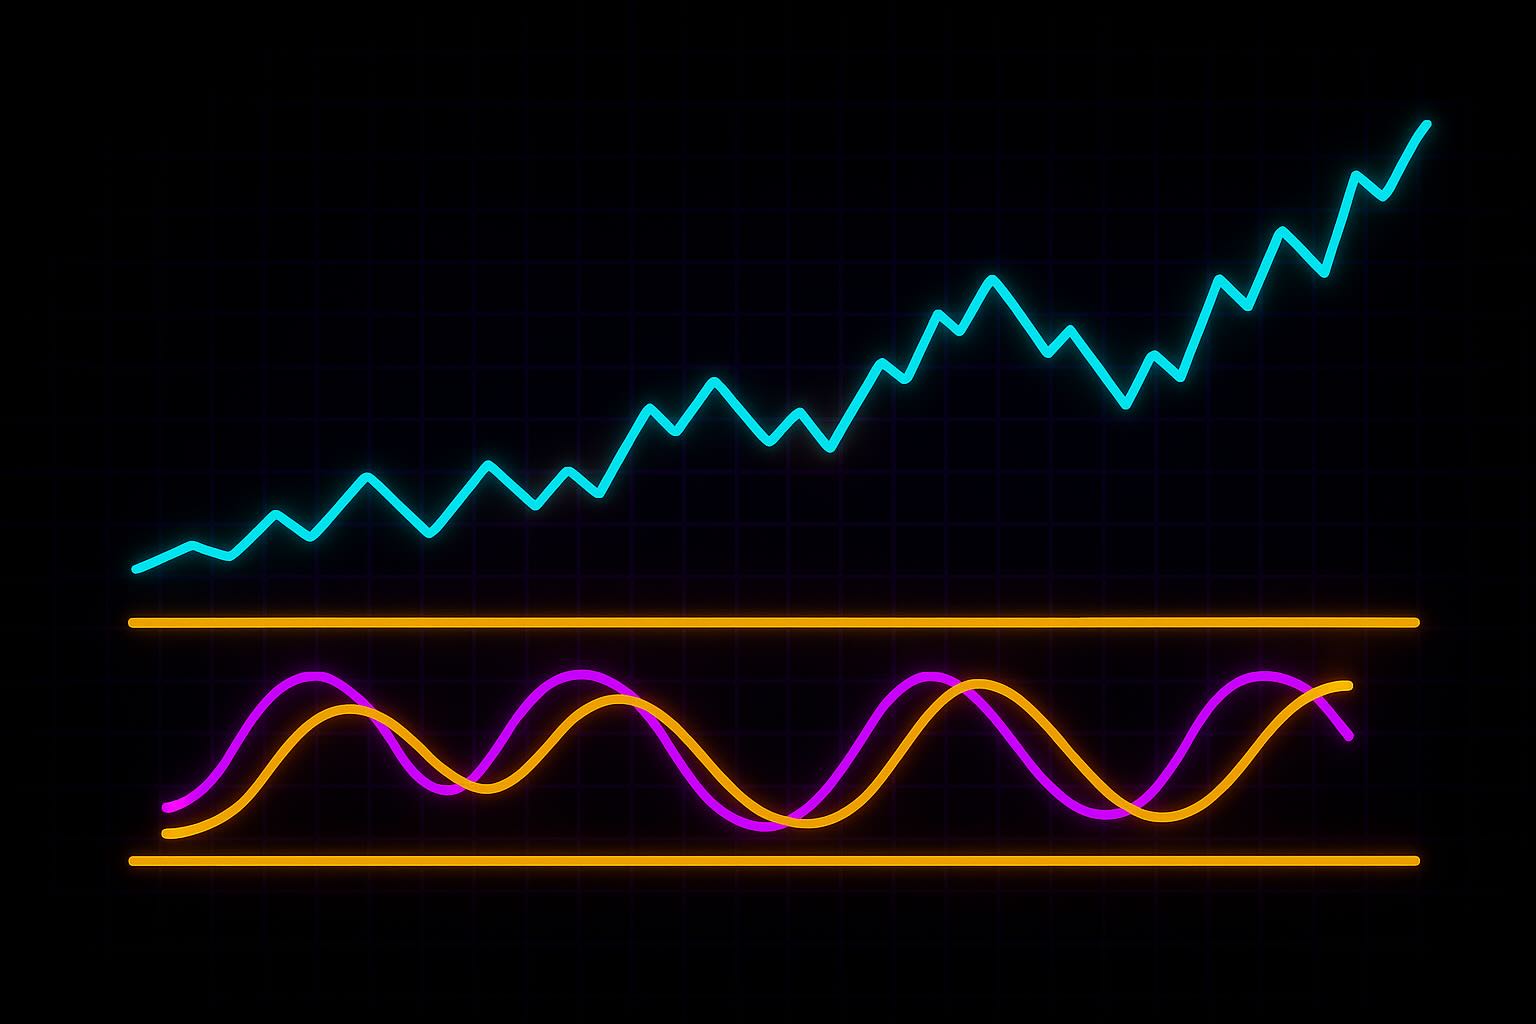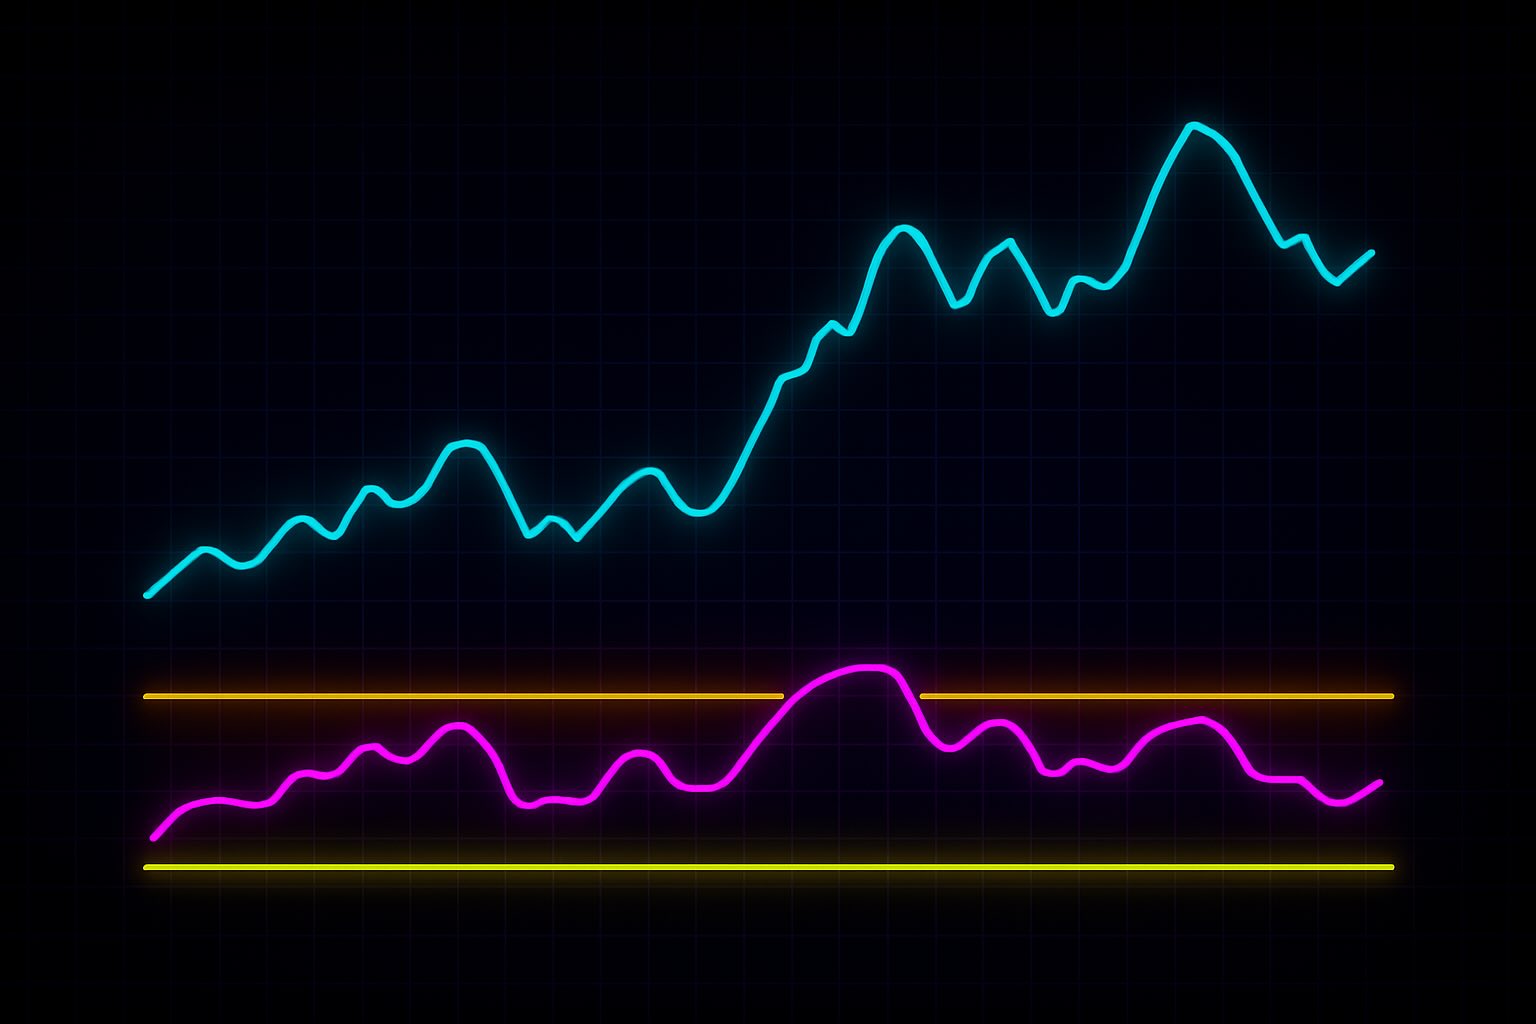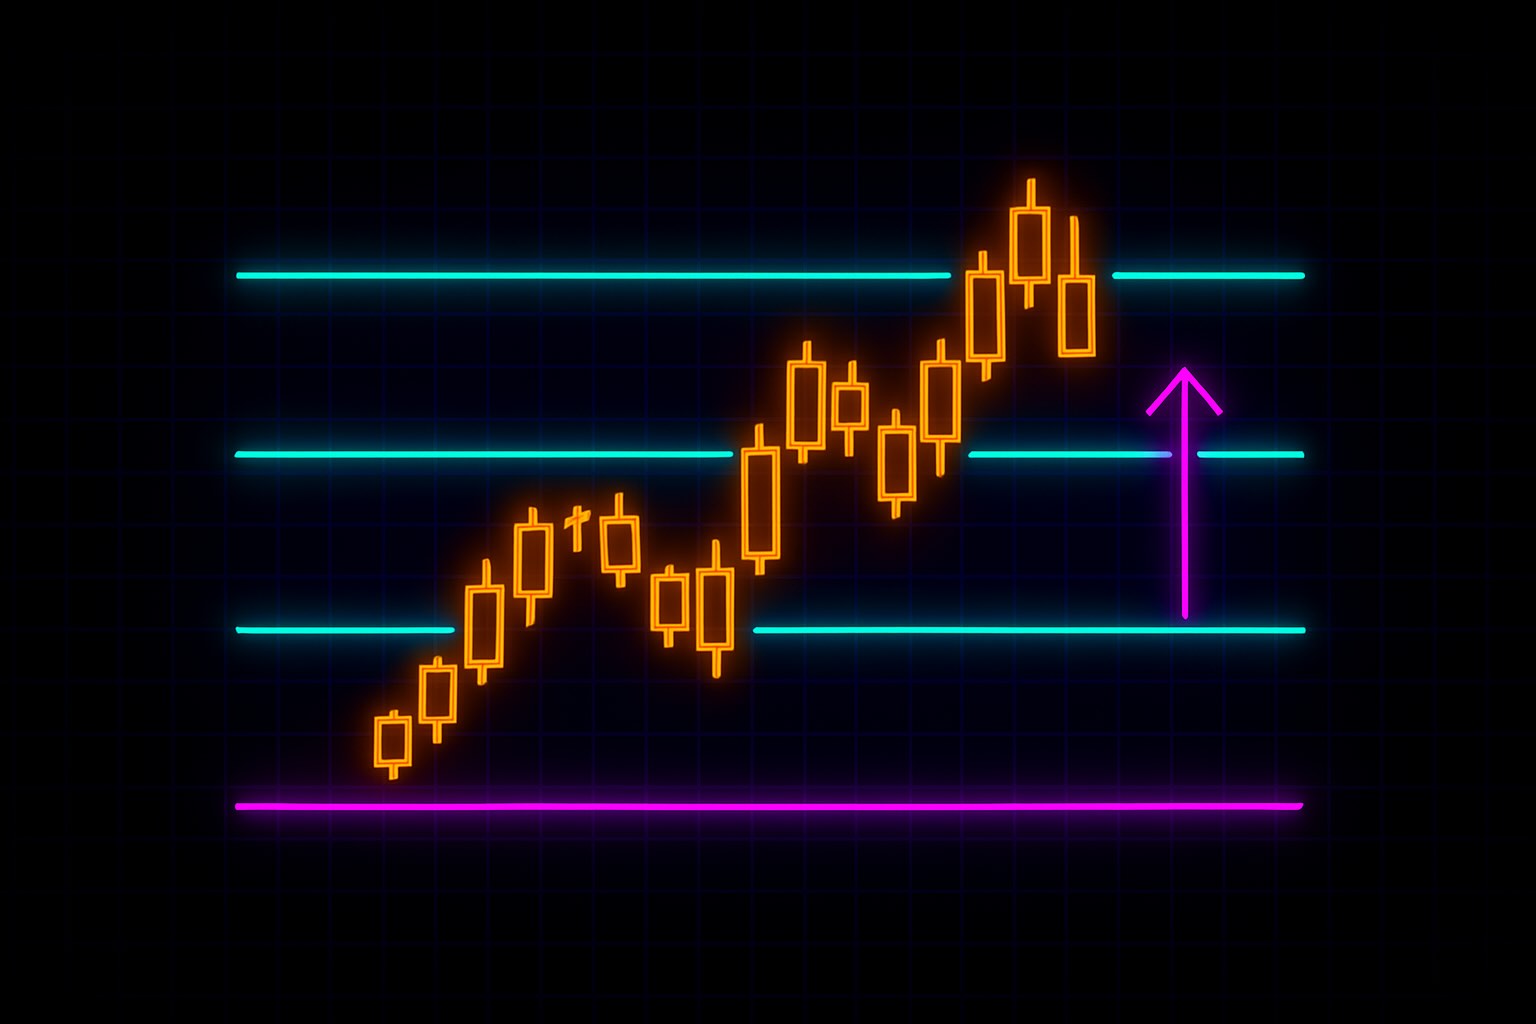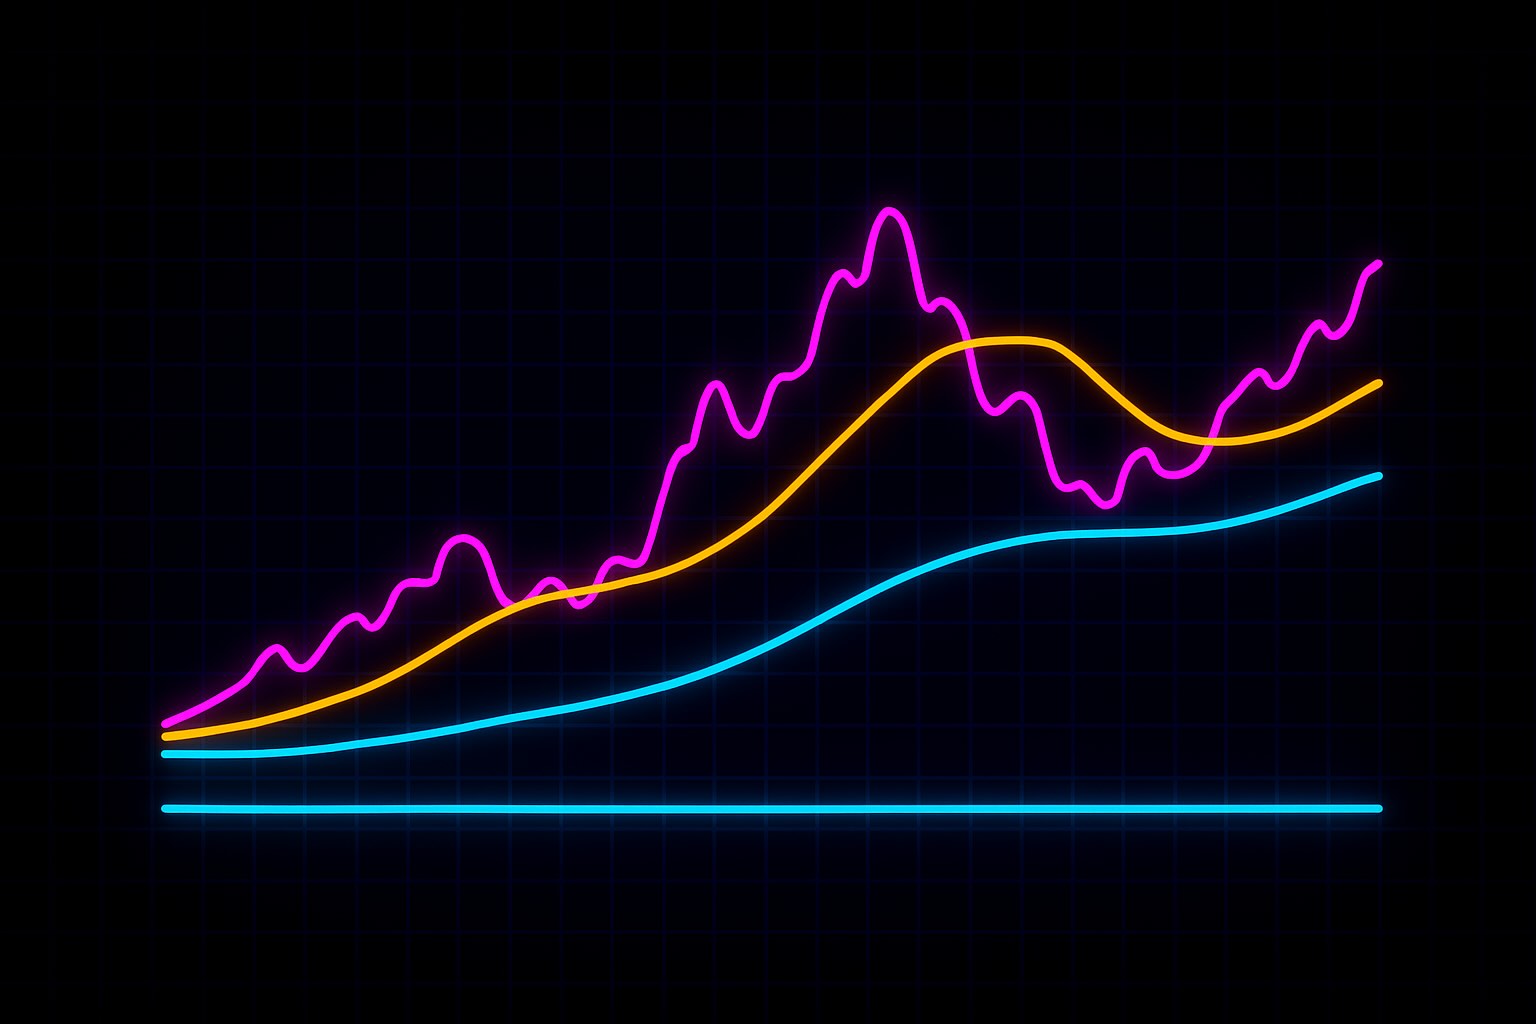
- Trendlines help reveal whether market pressure is still being respected or starting to fail.
- Their real value comes from the reaction around the line, bounce, hesitation, or clean break, not the line alone.
- Used well, trendlines improve timing by combining structure with price action, volume, and confirmation.
Trendlines: Structure Within Pressure
In this walkthrough, you’ll learn how to draw clean trendlines that actually matter — and how to read what price is telling you when it touches, bounces, or breaks away.
You’ll learn:
- When a trendline shows strength — and when it signals exhaustion
- How to combine price action, volume, and structure to confirm intent
- And how to use trendlines not just for direction — but for timing
This isn’t about guessing the next move.
It’s about seeing when pressure is real — and when it’s fading.
Because structure is what holds the market together.
And trendlines help you see when it’s about to shift.
Let’s begin.
What It Is — and Why It Matters
A trendline is one of the first tools most traders learn — and one of the most overlooked in its depth.
It’s not just a diagonal line.
A trendline reflects how price reacts to pressure over time. It shows where buyers consistently defend ground, or where sellers continue to push back. When drawn with care and read with context, it reveals where momentum is holding — and where it’s starting to slip.
Trendlines don’t predict where price will go.
They show you how pressure is behaving — until it changes.
That’s what makes them useful.
The Three Core Types — And What They Reveal
Think of trendlines as maps of pressure. Each type tells a different story about what the market is trying to do — and how well it’s doing it.
- Ascending Trendline
Higher lows. Buyers are stepping in sooner. Momentum is building.
→ Watch for confidence holding — or signs of fading reaction. - Descending Trendline
Lower highs. Sellers are applying pressure. Buying is weakening.
→ Watch for rejection zones and failed breakouts. - Horizontal Trendline
Repeated highs or lows. The market is compressing.
→ Often marks accumulation or distribution. A breakout matters more than the range itself.
These are not rules — they’re signals of behavior. And the real lesson isn’t in drawing the line. It’s in reading what price does around it.
When to Use a Trendline
You draw a trendline after a structure begins to form — not during random motion.
Use it when:
- A trend is clearly developing, and you want to track its strength.
- Price keeps reacting at similar diagonal levels — either bouncing or rejecting.
- You’re looking for structure to build a trade around — not instinct or emotion.
A trendline is most useful when combined with other tools:
- Volume
- Candlestick structure
- Previous support/resistance
- Moving averages or volatility shifts
It’s not just “touch the line = enter.”
It’s "read the behavior = decide."
A Guided Walkthrough: Ava’s Trade
Let’s follow Ava — a structured swing trader.
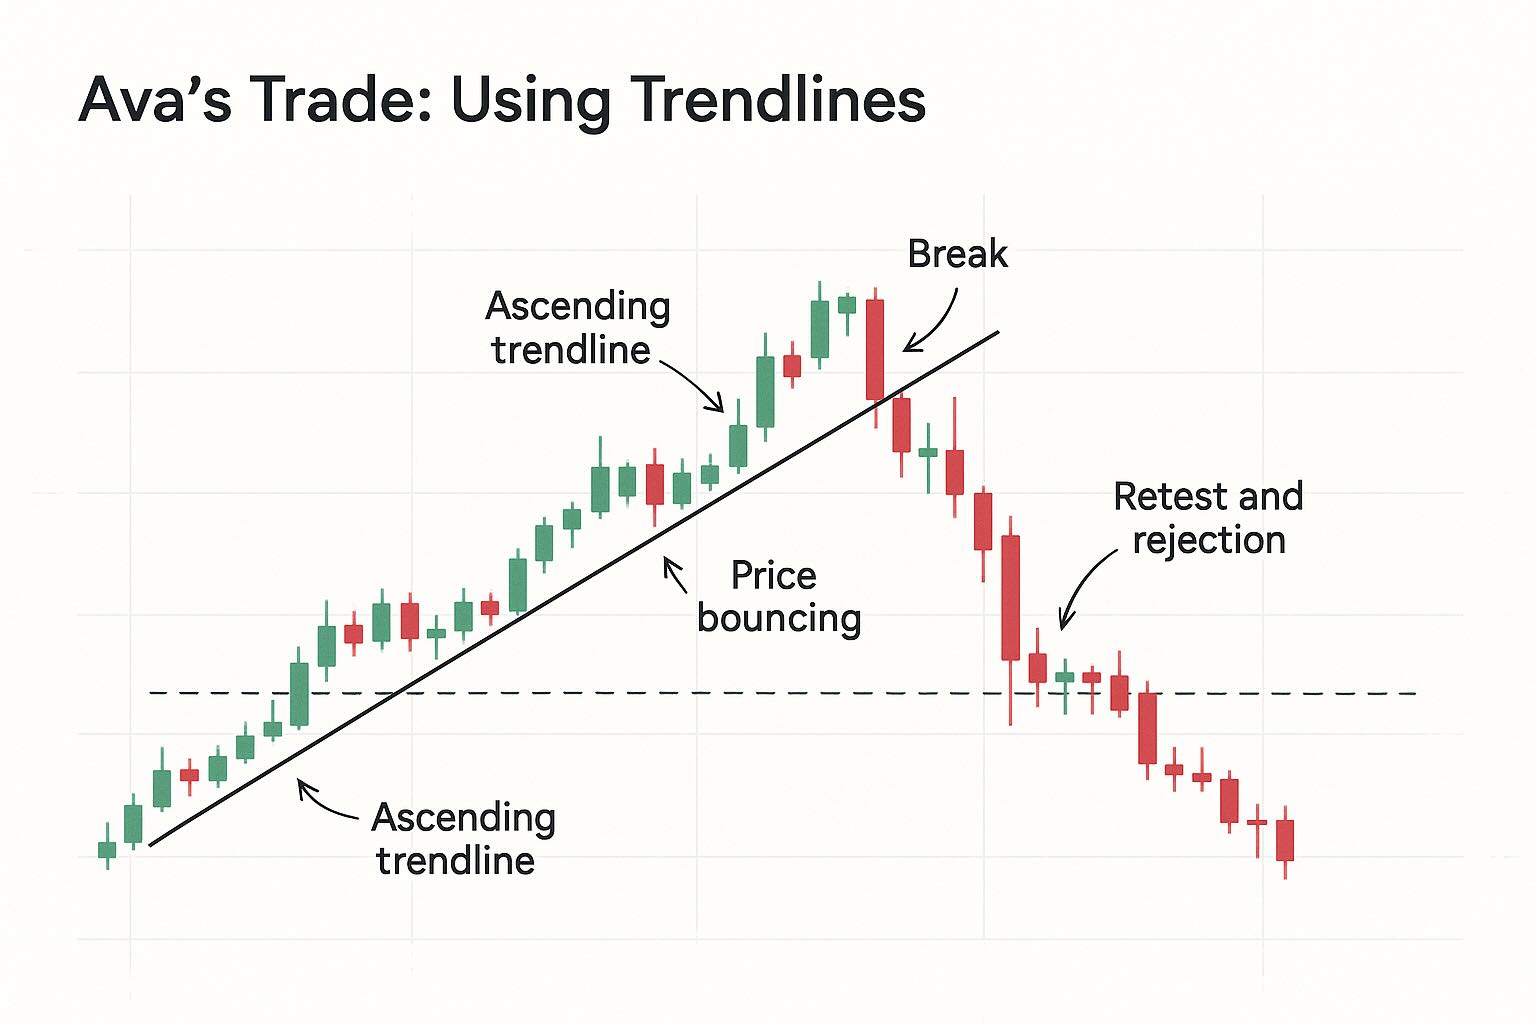
Solana (SOL) has been climbing from $18 to $26 in a steady rhythm. Price isn’t exploding — it’s building. Higher lows form at $18.50, $20.80, and $22.60.
Each time price pulls back, buyers return sooner — defending higher ground.
Ava connects these three reaction lows:
Her ascending trendline is now active.
But she doesn’t rush in.
She asks herself:
“Is this trend still being respected — or are we approaching exhaustion?”
She waits for a pullback.
Price retraces toward the trendline again — this time at $23.
She watches closely:
- Volume increases
- A long lower wick forms
- The zone aligns with a prior consolidation level
That’s confluence. Ava sees the market acknowledging the level — not randomly, but with pressure.
She waits for confirmation — a bullish engulfing candle closes above the line.
She enters the trade.
- Stop-loss: just below the trendline and prior swing low.
- Target: a retest of the recent high at $26 — possibly more if momentum holds.
This is not about drawing a line and buying the bounce.
This is observing reaction, confirming intent, and acting on structure.
The Break: When Structure Shifts
Two weeks later, price returns to the trendline — but this time, Ava notices a difference.
- Volume is fading
- Candles are small and indecisive
- Price is sitting on the line — not bouncing from it
Ava doesn’t react. She observes.
Then a sharp bearish candle closes below the trendline — with force.
She doesn’t trade immediately. She watches for confirmation.
- A failed retest follows — price rises back to the trendline, but is rejected.
- A lower high forms.
- A moving average crossover supports the shift.
Now structure has changed.
Ava begins planning a short trade — using the broken trendline as resistance, not support.
The same tool — used in both directions.
Not because the line is magic.
Because price behavior changed around it.
How to Read the Reaction
The line is not the signal. The reaction around the line is.
Ask:
- Is price accelerating into the trendline — or pausing?
- Are bounces clean, or getting weaker over time?
- What’s volume doing — rising, flat, or fading?
- Does the zone line up with other structure — like horizontal support, volume spikes, or candle patterns?
If the reaction is strong, and confluence builds — it might be a continuation.
If the reaction is weak, or price slices through with no hesitation — that’s just as important. It’s not failure. It’s information.
Ava’s Mental Model — Her Process for Using Trendlines
- Identify a structure. Don’t draw lines on noise. Wait for clear swing points.
- Draw from reaction zones. Use levels where price clearly turned — not just any low or high.
- Wait for price to return. The test matters more than the first move.
- Read the behavior. Look at volume, candles, and alignment with other tools.
- Use confirmation. Let the market prove its intent before you enter.
- Adapt when it breaks. A broken trendline doesn’t end the trade — it opens a new perspective.
Kodex Perspective
Trendlines are tools for identifying structure — not for predicting outcomes.
They help you see how price has responded to pressure in the past, and where it might do so again. When used well, they support disciplined trading by helping you:
- Track the strength and direction of a trend
- Spot early signs of potential reversals
- Avoid emotional or impulsive entries
- Make decisions based on structure instead of instinct
But the trendline itself isn’t a signal.
What matters is how price behaves around it.
At Kodex, we draw trendlines to observe behavior — not to forecast direction. We respond to what the market is showing us, not what we hope will happen.
Use the trendline to stay focused.
Use confirmation to decide if it’s valid.
And if the structure breaks — be ready to adjust.
Open the Kodex simulator, find a chart climbing in a steady rhythm of higher lows, and draw an ascending trendline through them. Then wait for price to return to the line and read the reaction, not the line itself: is the bounce clean with volume rising, or are the candles sitting flat until a close slips through? Stay with it until you can feel the difference between a trendline being respected and one about to break, on a practice balance that keeps your real capital out of the test.