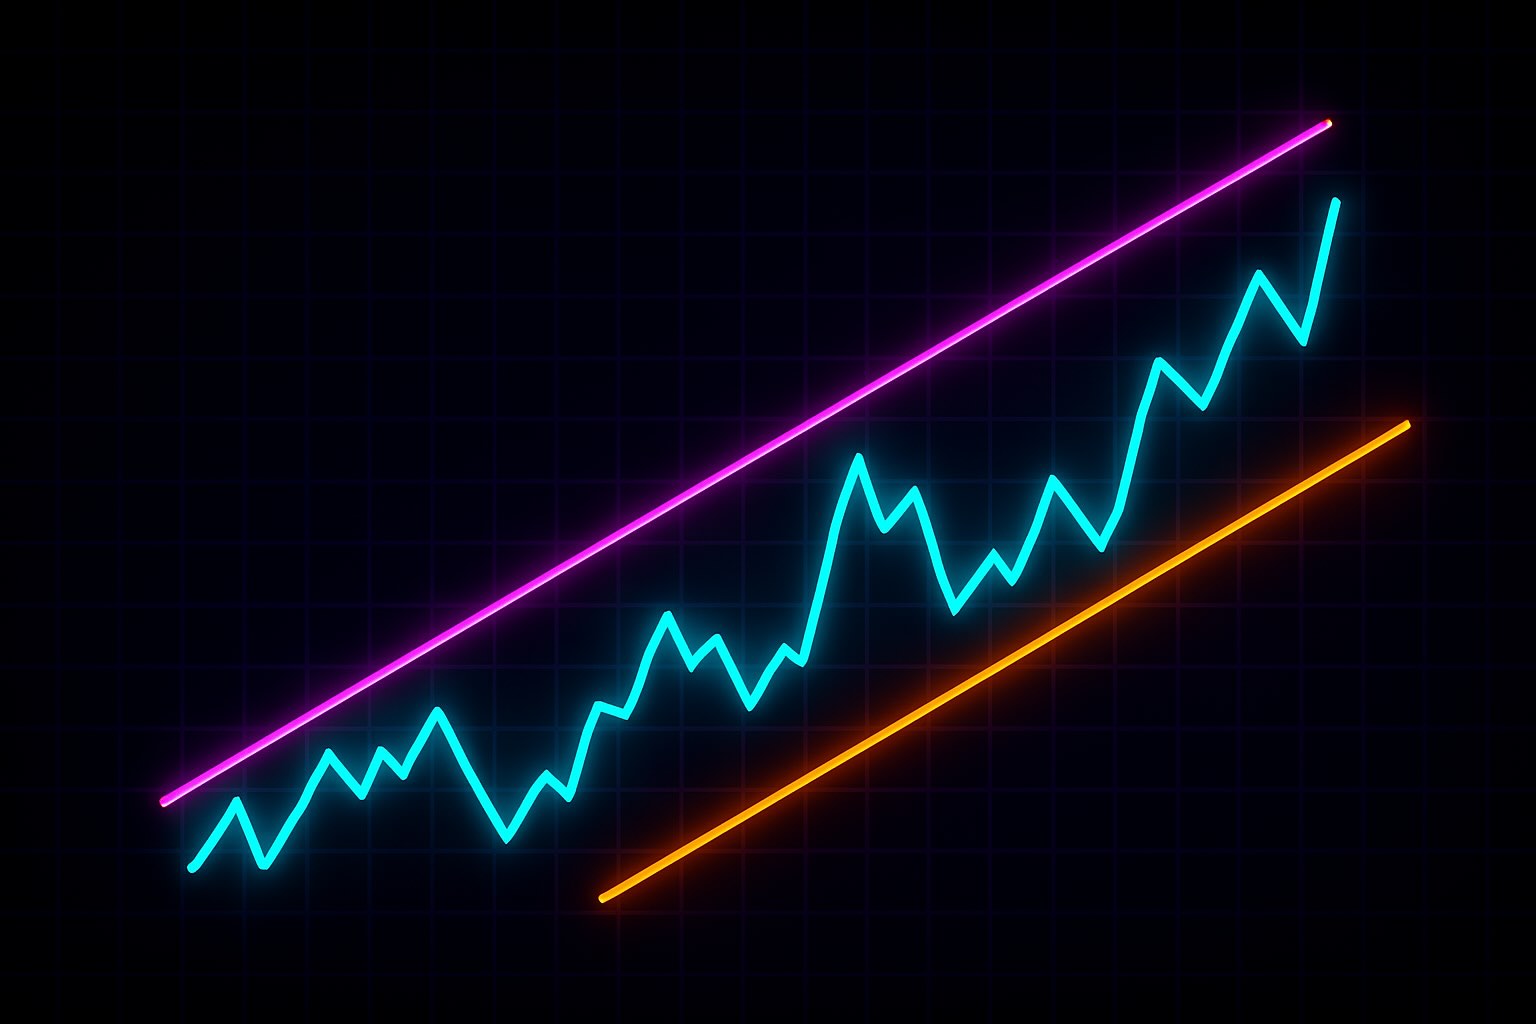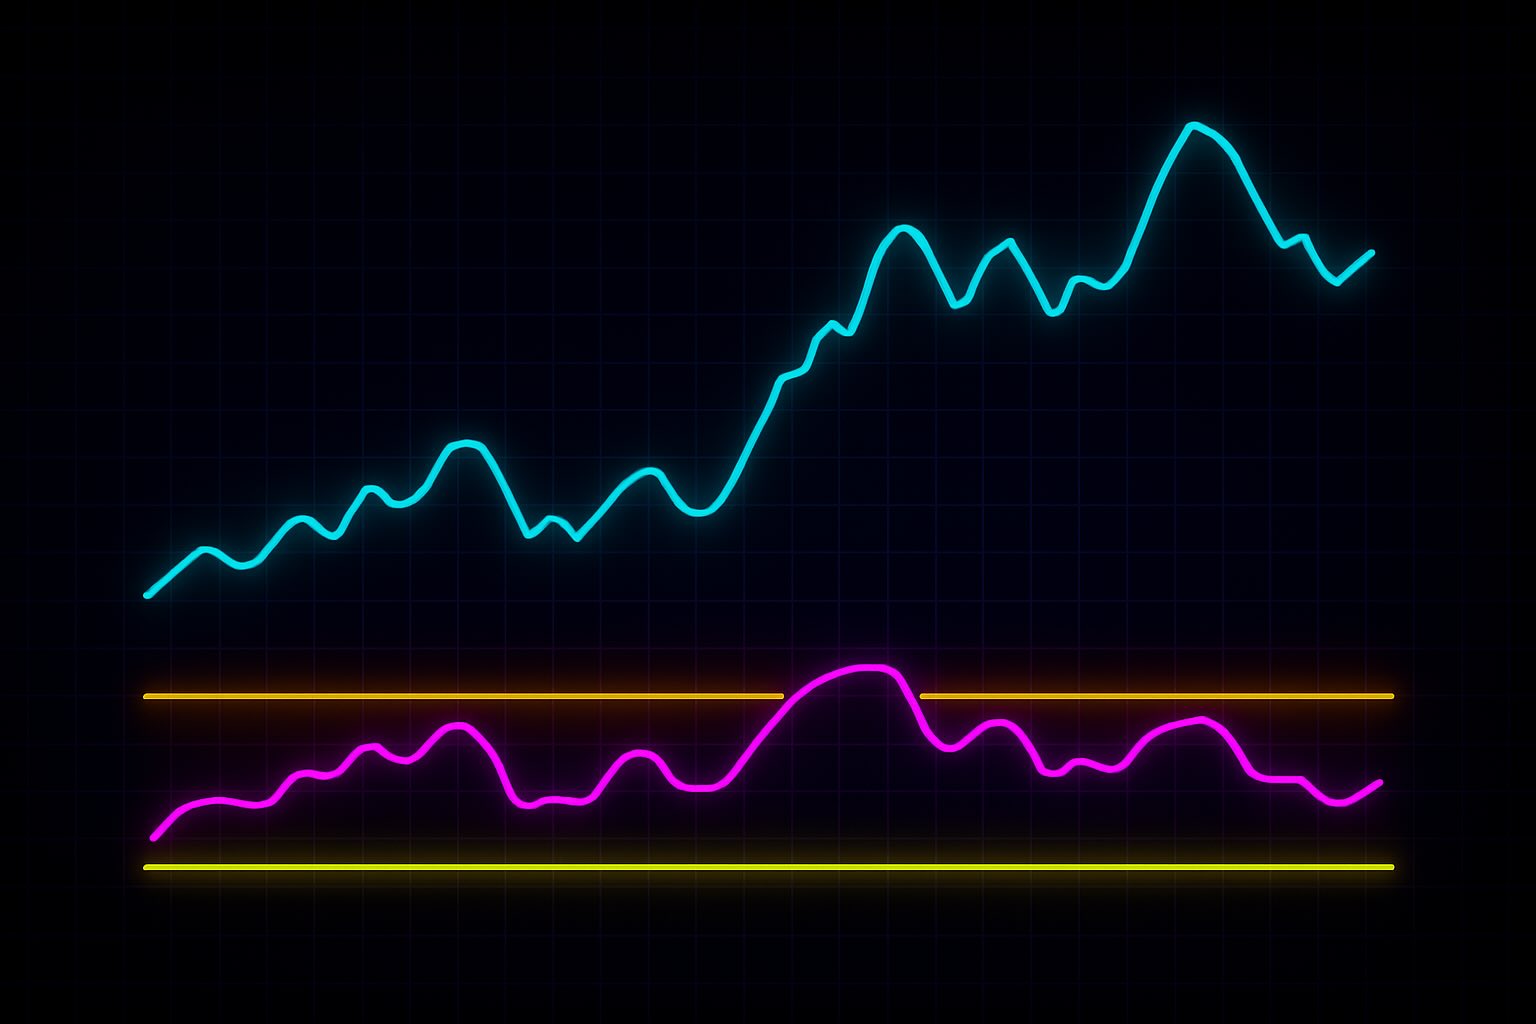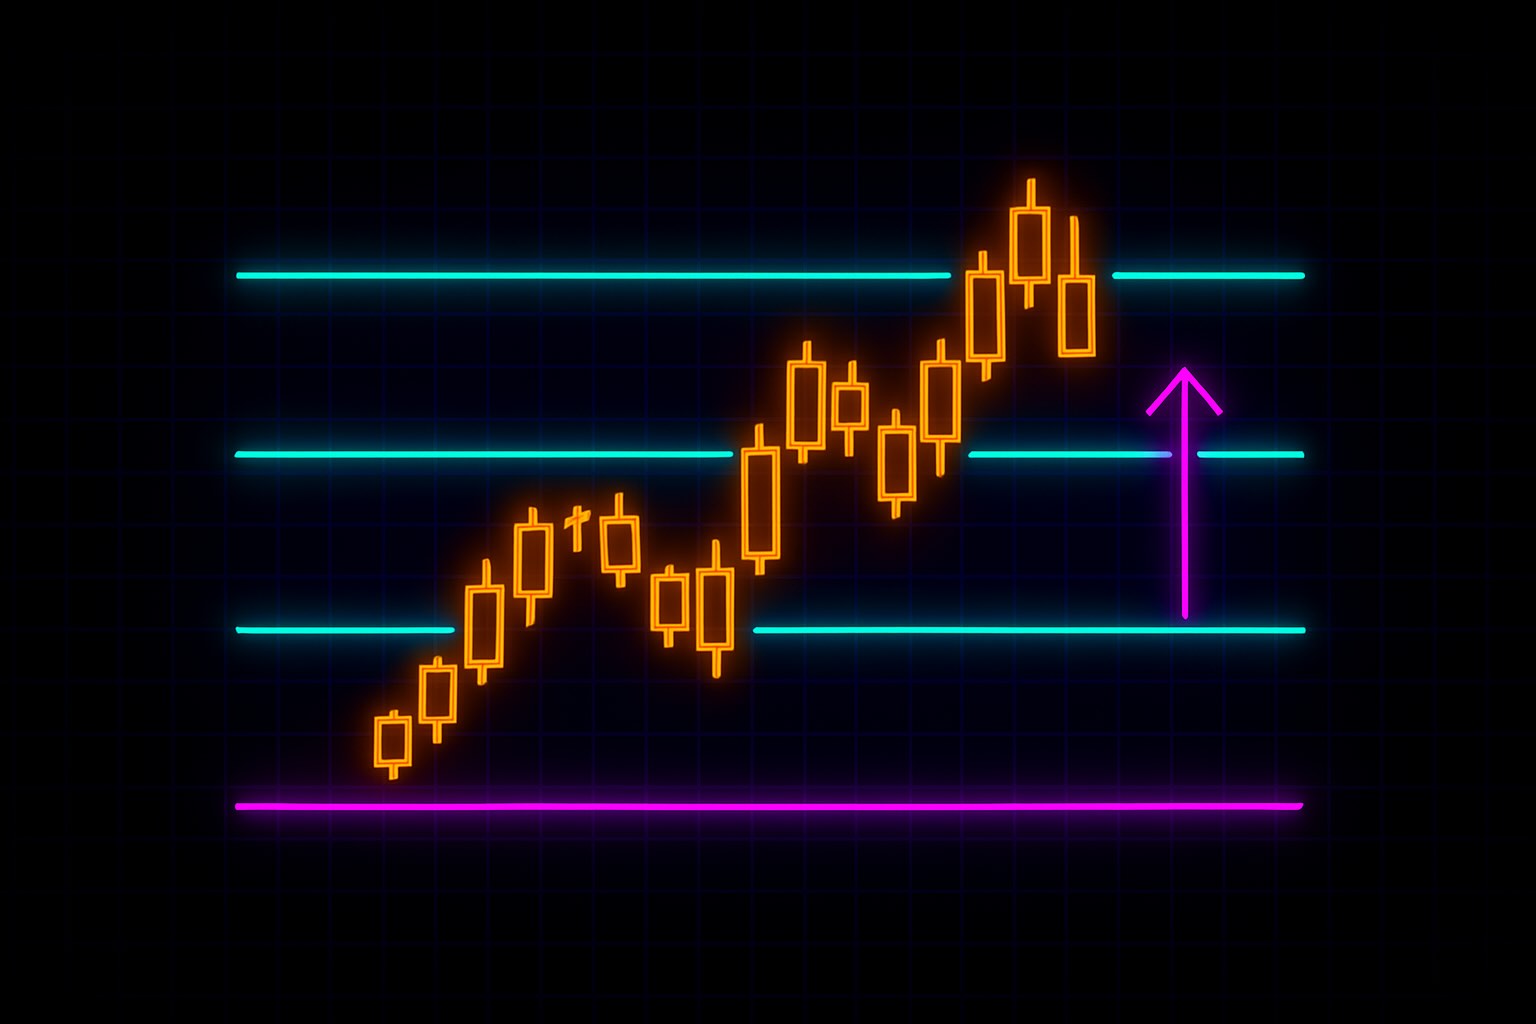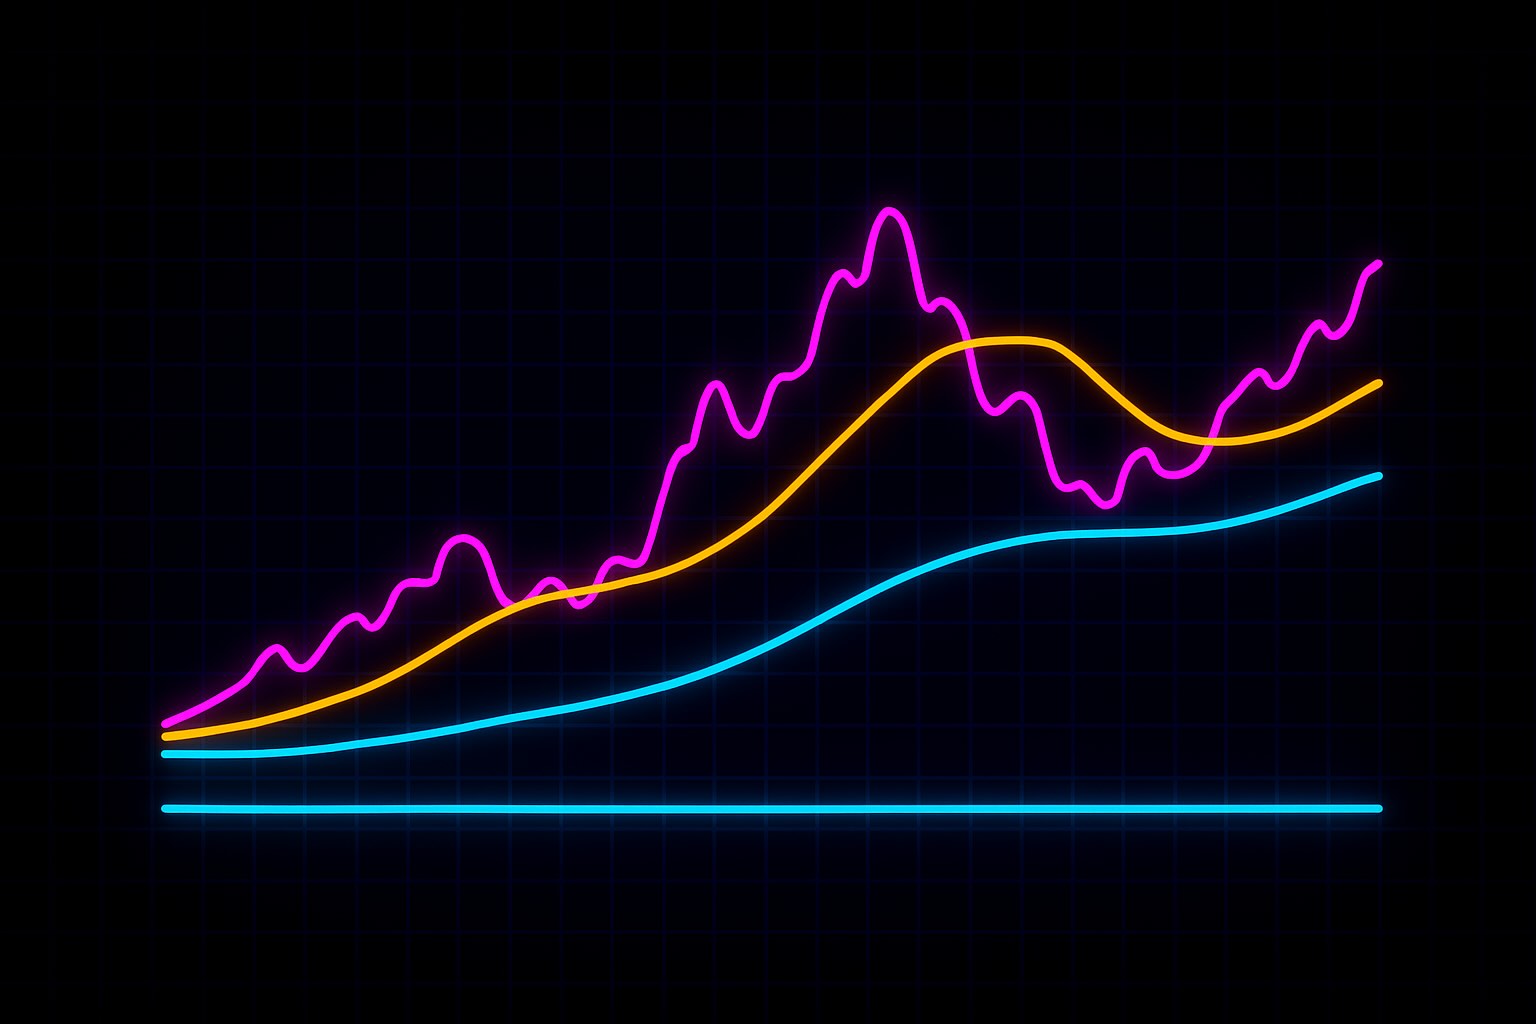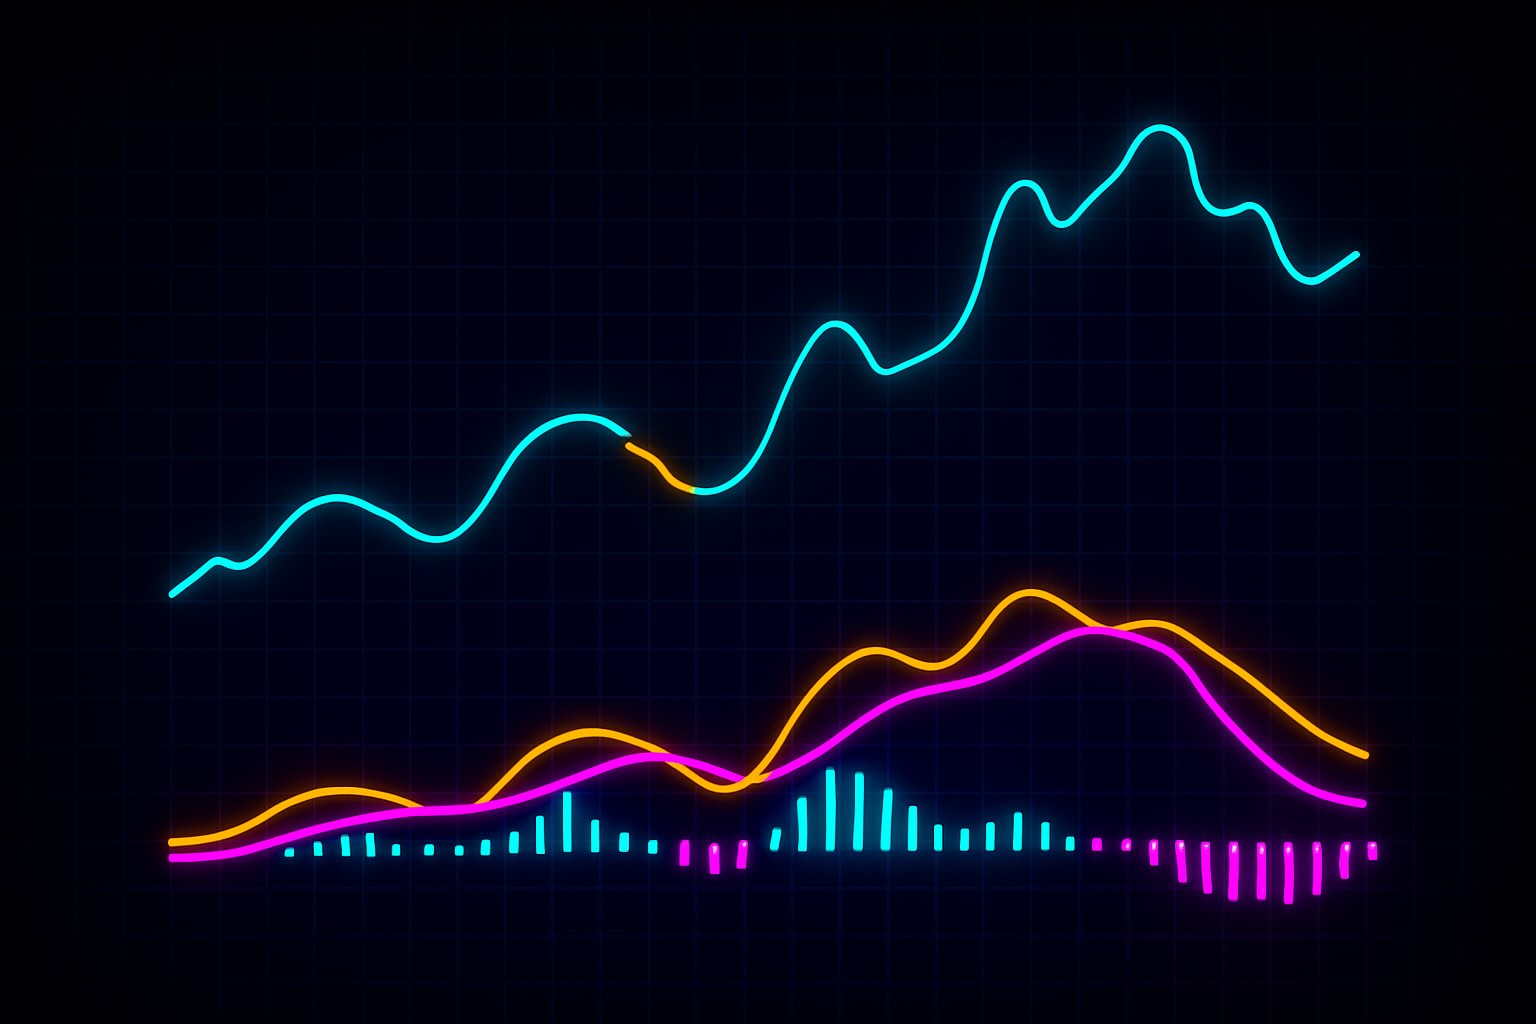
- The Stochastic Oscillator shows whether momentum is still supporting price near the edges of its recent range.
- It is most useful for spotting slowing momentum, exhaustion, or divergence near key support and resistance.
- The edge comes from combining Stochastic signals with structure, not treating overbought or oversold alone as a trade.
Stochastic Oscillator: Momentum Within Limits
In this walkthrough, you’ll learn how to read the Stochastic as a sign of energy — not prediction. You’ll see how it helps confirm strength, spot early signs of exhaustion, and avoid chasing moves that no longer have real support.
Because what matters isn’t just where price is.
It’s how committed the market is to staying there.
Let’s begin.
What It Is — and Why It Matters
Momentum often shifts before price does. That’s where the Stochastic Oscillator becomes useful — not as a prediction tool, but as a way to observe how strong or weak a move really is.
The Stochastic measures where price is closing within its recent range, typically over the last 14 periods. The idea is simple: in strong trends, price tends to close near the extremes. When that behavior fades, it can signal slowing momentum — and a possible reversal or pause.
It doesn’t tell you when to buy or sell.
It tells you when momentum is no longer confirming the move.
That makes it a useful tool for identifying potential exhaustion, especially when combined with structure or confluence.
But like all indicators, it’s only as useful as the context it’s read in.
The Signal — and What It Shows You
The Stochastic Oscillator consists of two lines, both plotted on a scale from 0 to 100:
- %K — the fast line, which measures the current closing price relative to the recent high-low range
- %D — a smoothed version of %K, typically shown as a 3-period moving average
The oscillator doesn’t follow price directly. Instead, it reflects where price is closing within its recent range — not how far it’s moved overall.
Key zones:
- Above 80 — Price is near the top of its recent range. This is often called the “overbought” zone — not because price must fall, but because upward momentum may be reaching its limit.
- Below 20 — Price is near the bottom of its recent range. Often labeled “oversold,” this suggests bearish pressure may be slowing or due to reverse.
What matters most isn’t just the number — it’s the behavior of the lines:
- A cross down near the 80 zone may signal momentum fading in an uptrend
- A cross up near the 20 zone may suggest a potential bottom forming
- A failure to reach 80 or 20 in a trend can also be meaningful — showing weakening conviction
Stochastic signals are more effective when aligned with structure:
- A rejection from resistance with an overbought cross-down? That’s confluence.
- A break of support with oversold momentum? That may confirm breakdown.
The oscillator doesn't lead price.
It shows when momentum is no longer in sync with it.
When to Use the Stochastic Oscillator
The Stochastic Oscillator is most useful when you want to understand how strong a move really is — especially when price approaches a key level. It helps you evaluate whether momentum is confirming the move, fading, or diverging from what price appears to show.
You’ll use it most effectively when:
- A trend is reaching known support or resistance
- Price is consolidating and you're watching for a breakout or reversal
- You want a second layer of insight to confirm or challenge a setup based on structure
It's especially helpful when trading within a range. In those conditions, the oscillator’s overbought and oversold zones can help you identify potential turning points.
But it has limits.
The Stochastic doesn’t work well in fast, breakout-driven markets where price keeps running beyond expectations. In strong trends, it can stay overbought or oversold for extended periods — and crossing down doesn’t mean price will fall right away.
That’s why it’s best used with structure — not in isolation.
When momentum lines up with what price is doing, it can add conviction.
When it disagrees, it doesn’t always mean reversal — but it’s a signal to pay attention.
A slowing oscillator isn’t the end of a move.
It’s a sign that the energy behind it might be changing.
A Guided Walkthrough: Ava Reads the Stochastic
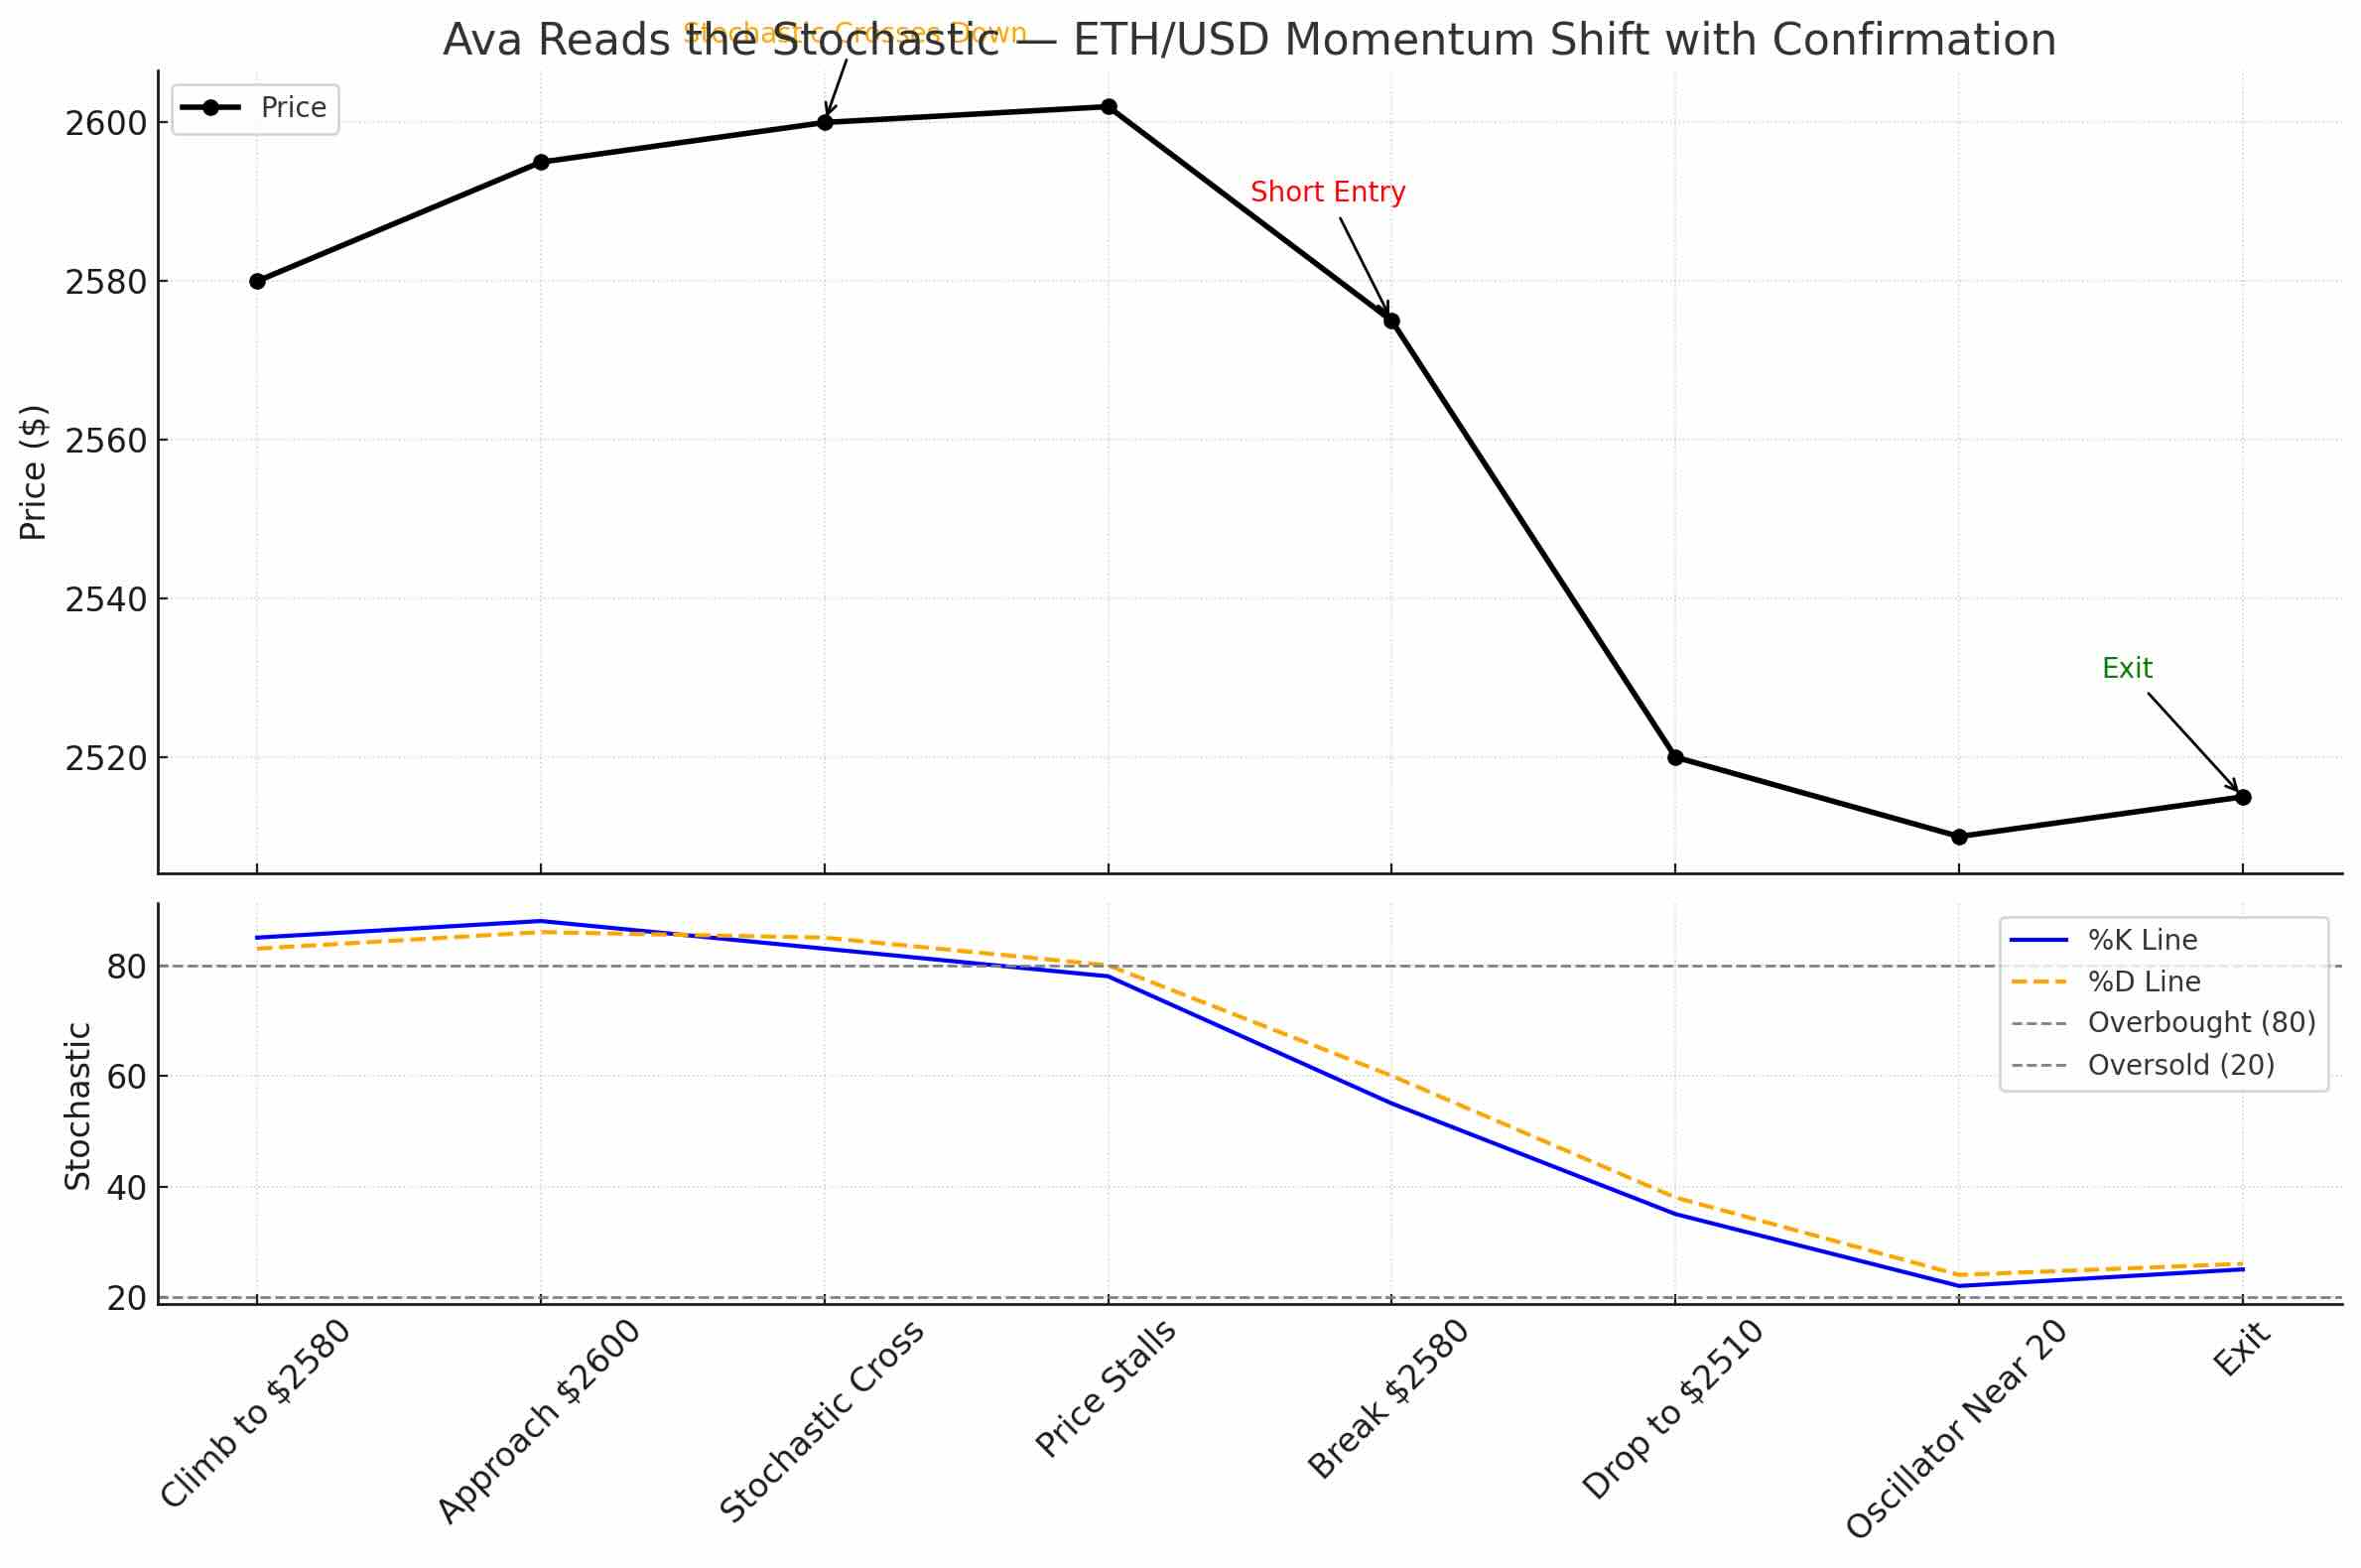
Ava is watching Ethereum, which has just pushed from $2,400 to $2,580 over the past three days. The move has been clean — higher highs, strong candles, steady volume. But now price is approaching a familiar resistance zone at $2,600.
Instead of jumping in or stepping back, Ava checks momentum.
She pulls up the Stochastic Oscillator on the 4-hour chart.
The %K line is above 80 and just crossed down through the %D line. Momentum is still positive, but it's slowing — right at resistance.
That’s the first clue: price is high, but buyers may be losing energy.
She waits. Price pokes above $2,600 — briefly breaks it — but then stalls.
Candles shrink. Volume fades.
The oscillator remains above 80 but both lines are now turning lower. Ava sees this not as a sell signal — but as a loss of strength.
She doesn’t short impulsively. She watches for structure.
A few hours later, ETH breaks below $2,580 — a key minor support — and closes beneath it. That’s her confirmation. She enters short.
Her stop-loss goes just above $2,610 — in case buyers reclaim momentum.
Her target is $2,500 — the next support where previous consolidation formed.
Price moves in her favor gradually. By the time ETH reaches $2,510, the oscillator is near 20 — and beginning to turn.
Ava exits.
She didn’t enter because of the oscillator alone.
She used it to identify where momentum and structure aligned — and to avoid chasing a move near exhaustion.
How to Read the Reaction
The Stochastic Oscillator isn’t about spotting tops or bottoms. It’s about recognizing when momentum is no longer confirming what price is doing.
Ava doesn’t trade based on overbought or oversold signals alone. She reads the context:
- If price is rising and the oscillator is rising too, momentum is in sync. The move is likely healthy.
- If price keeps rising but the oscillator flattens or turns down, momentum may be fading — a possible sign of exhaustion.
- If the oscillator crosses down while price approaches resistance, that adds confluence. But she still waits for price confirmation.
She also watches for divergence — when price makes a new high or low, but the oscillator doesn’t follow. That often signals imbalance between price and energy, and tells her to watch closely for reversal structure.
But divergence alone doesn’t justify action. It’s a signal to become more focused — not to force a trade.
If price confirms the shift — by breaking structure or rejecting a level — that’s when Ava engages.
If not, she steps back and keeps observing.
Momentum is information.
It’s not the entry.
Ava’s Mental Model — Her Process with the Stochastic
Ava doesn’t treat the Stochastic Oscillator as a signal generator. She uses it to measure whether momentum is supporting the move — or separating from it.
Before anything else, she checks the overall structure.
Where is price in the bigger picture? Is it trending, ranging, or testing a key level?
Only then does she look at the oscillator.
If price is rising toward resistance, and the Stochastic is entering the overbought zone, Ava watches for signs of momentum weakening — not for a guaranteed reversal.
She’s most interested in crosses, flattening, or divergence near significant structure. That’s when she pauses and observes, not when she acts.
She never enters a trade just because the oscillator crosses.
She waits for price to confirm the signal — through rejection, break of structure, or a clear change in behavior.
Her best trades come when momentum confirms structure — or when it clearly fails to support it.
And if the signal appears too early — or price refuses to react — she waits. The oscillator may be right, but timing without context means nothing.
For Ava, the Stochastic is a tool for understanding energy — not for making predictions.
Kodex Perspective
The Stochastic Oscillator isn’t about calling reversals.
It’s about recognizing when momentum is no longer aligned with price.
Used well, it helps you avoid late entries, stay out of overextended moves, and time your trades with more clarity. But it’s not a trigger on its own. It’s part of a broader system — one that combines structure, confirmation, and behavior.
At Kodex, we don’t act on indicators in isolation.
We use them to observe what’s changing — not to predict what comes next.
Momentum tells you when a move has energy.
Structure tells you when it matters.
You need both.
Let the oscillator guide your awareness.
Let structure confirm your plan.
And let momentum — not hope — shape your entry.
Add the Stochastic to a chart in the simulator and find a moment where %K crosses down through %D near 80 while price sits at resistance. Then do the harder thing: wait until price actually breaks structure before you act, and count how many crosses fade with no follow-through. The balance is simulated, but the impatience you have to sit through is completely real. Pull up a chart and watch a cross lie to you at funkleville.com.