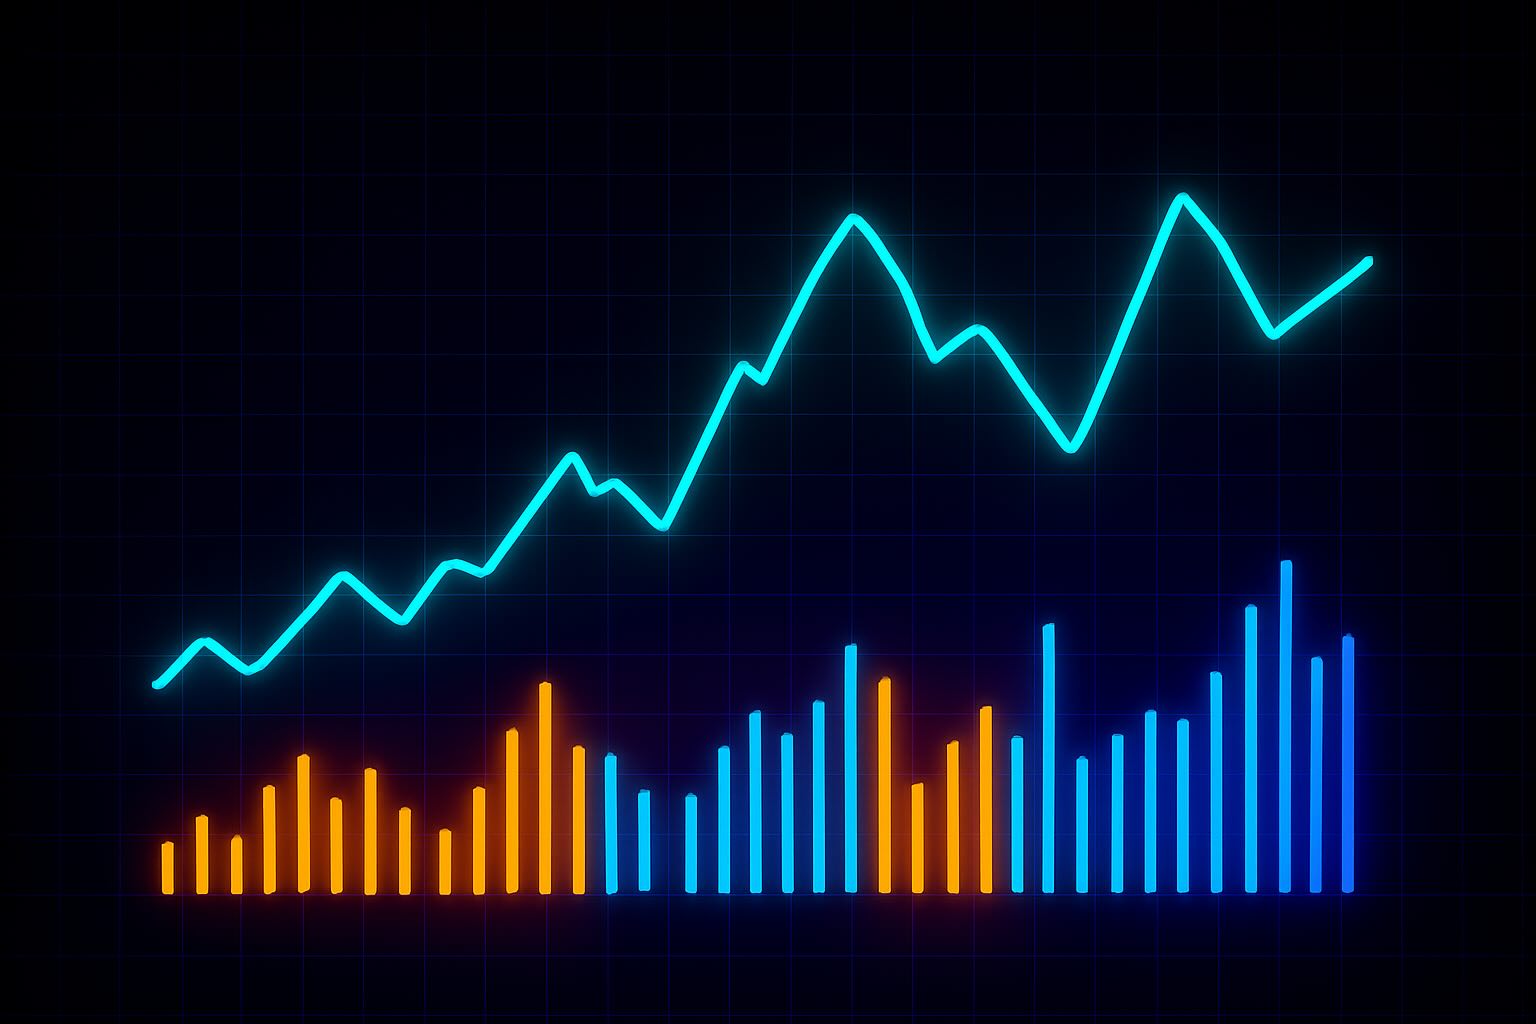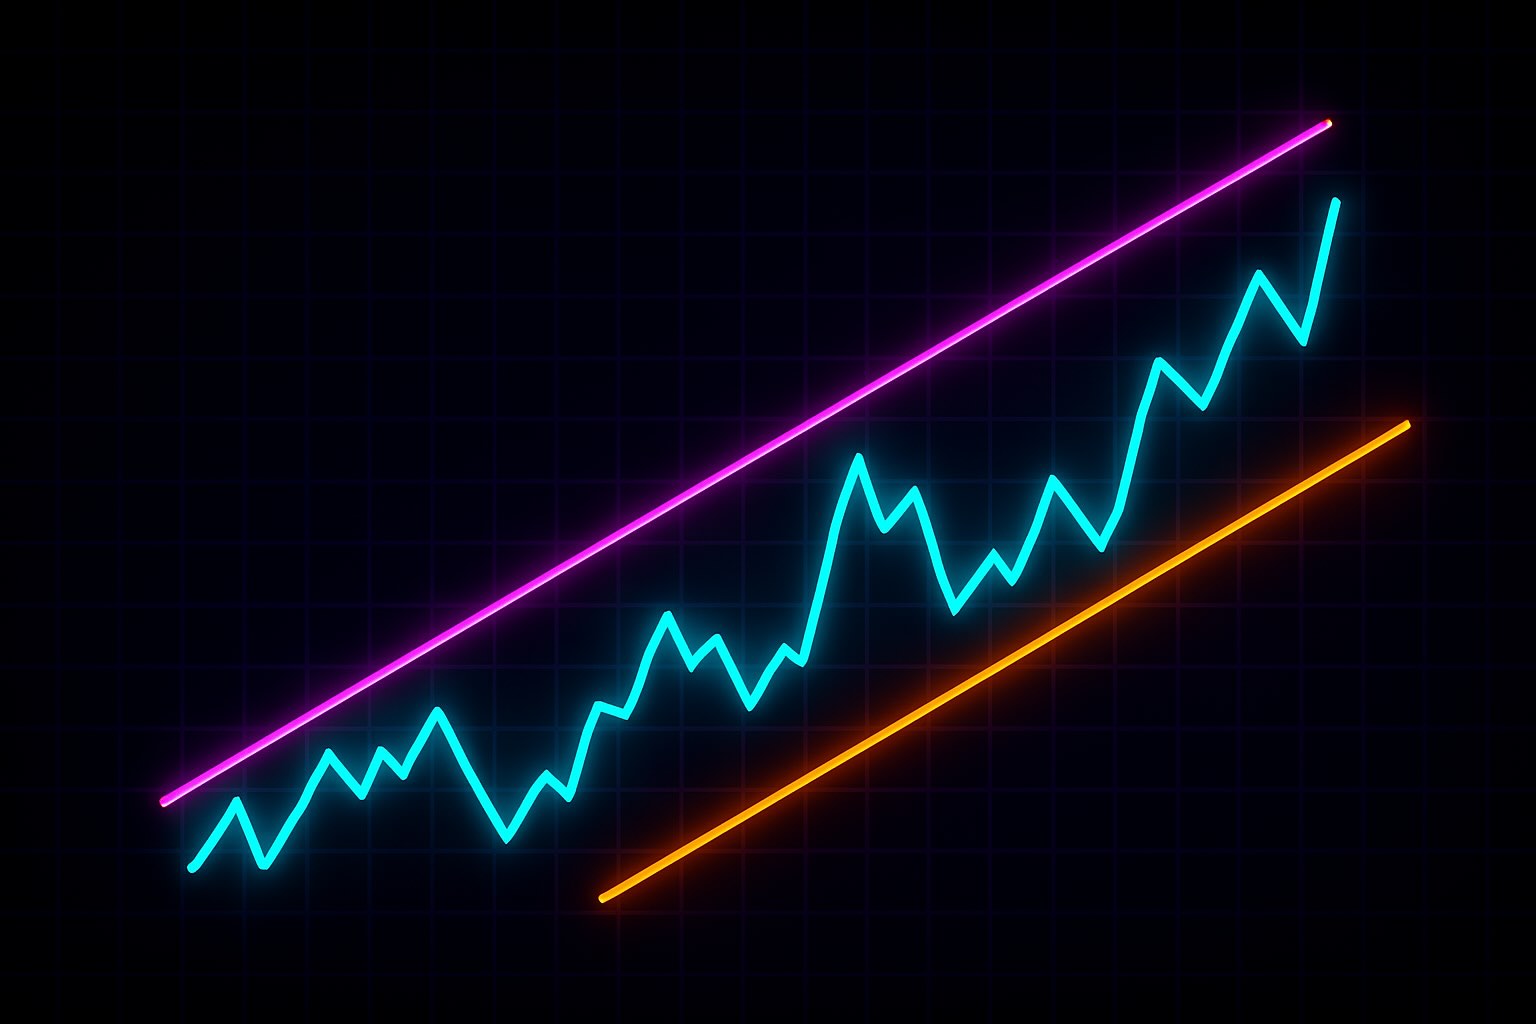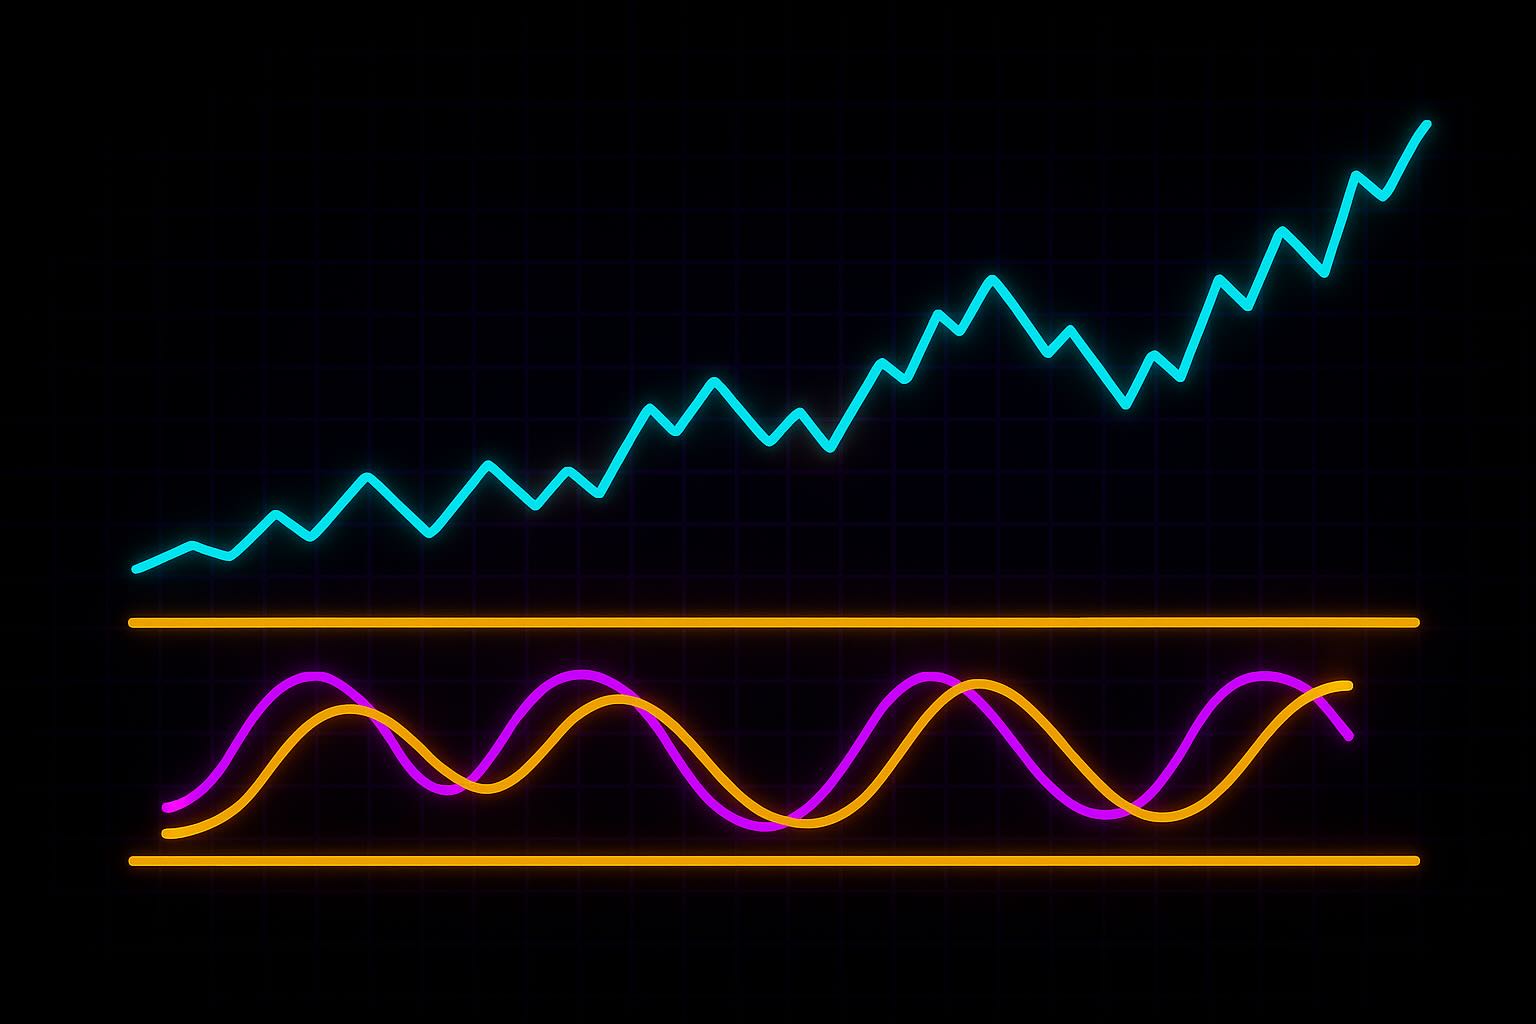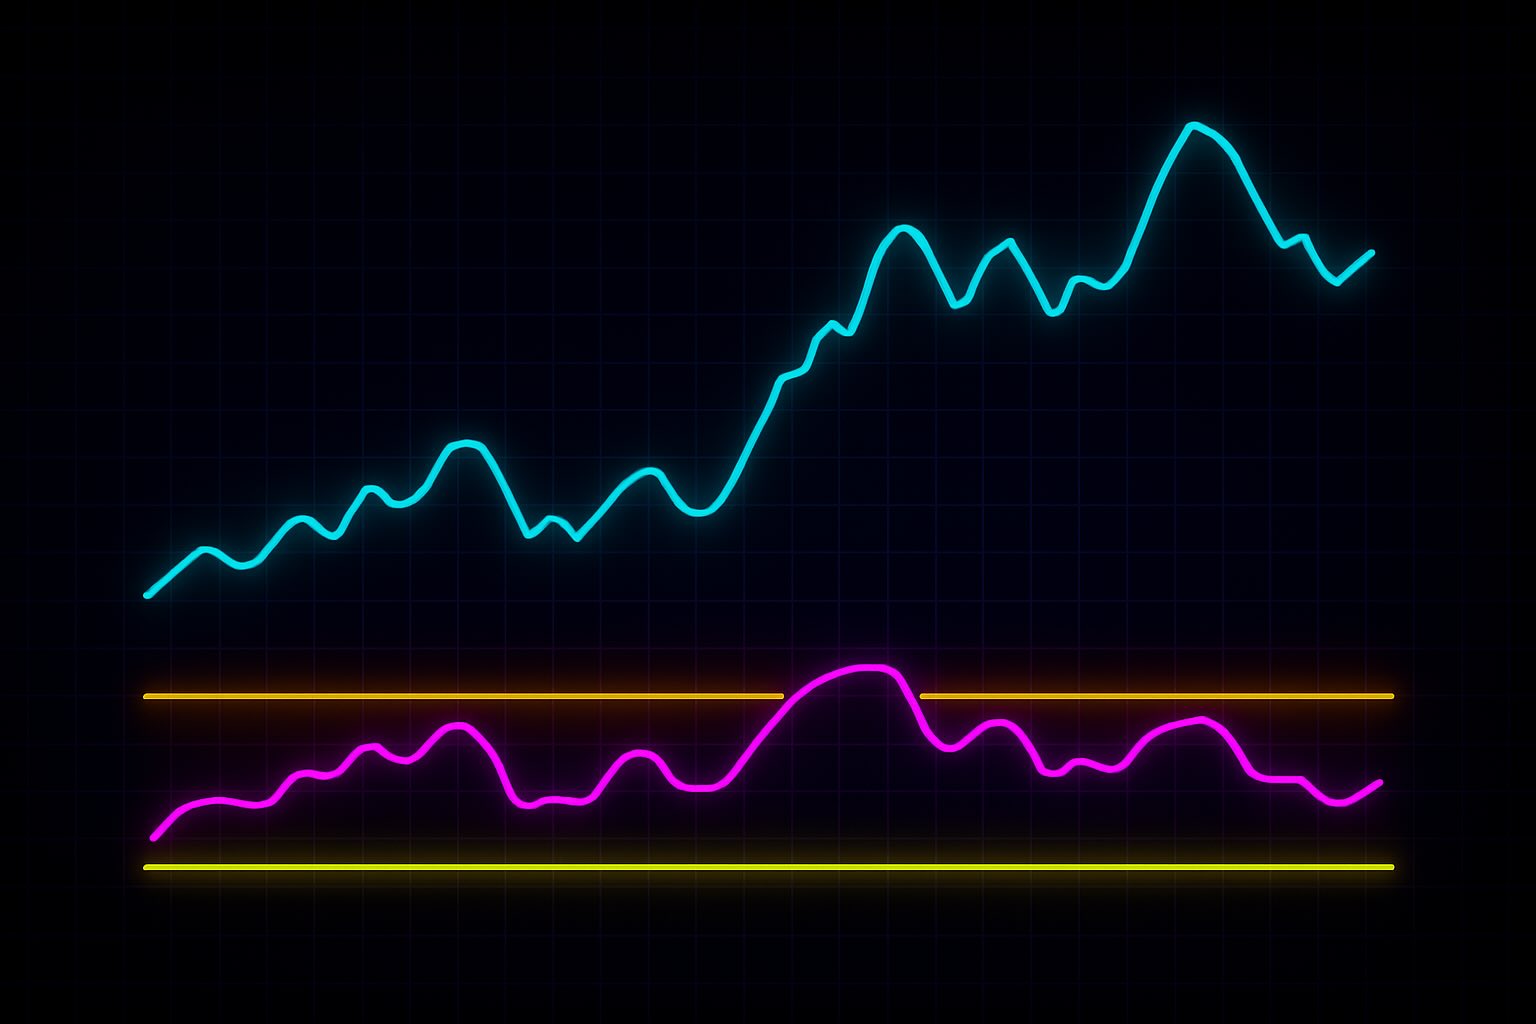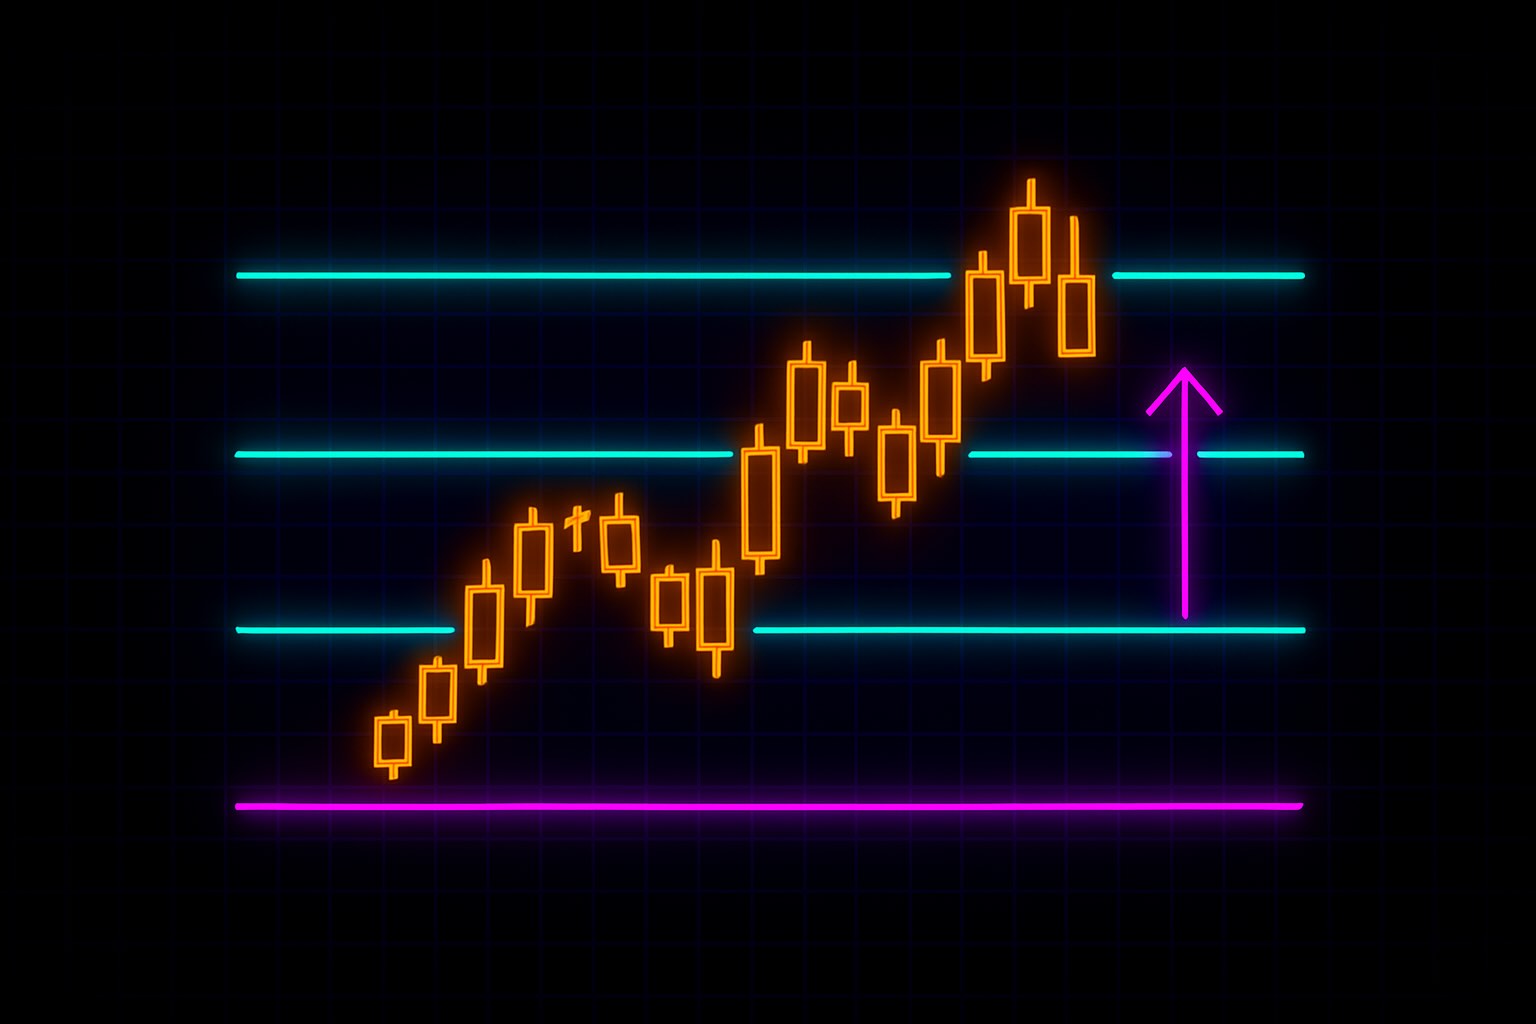
- Fibonacci Retracement helps identify where a pullback may pause, hold, or fail within a larger trend.
- Its levels matter most when price action, volume, and structure confirm a real reaction.
- The real edge is using Fibonacci to wait for clarity, not chase moves or guess reversals.
Fibonacci Retracement: Know When to Enter — And When to Wait.
Big moves don’t last forever. Price pulls back — and inside that pullback is opportunity.
Fibonacci levels help you see where that pause might happen — and how strong it really is.
In this walkthrough, you’ll learn how to:
- Identify the zones where a trend might bounce or break
- Combine structure, volume, and price behavior for clean entries
- Avoid chasing — and wait for the reaction that tells you it’s time
This isn’t a guessing tool.
It’s a way to slow down, read the move, and act with clarity.
Because timing matters.
And clarity beats luck — every time.
Let’s begin.
What It Is — and Why It Matters
Fibonacci Retracement is a method used to observe the structure of a market's pullback — not to predict outcomes, but to measure potential reaction zones during a trend. In a world full of noise, it offers proportion. Structure. A disciplined way to make sense of movement.
After a strong rally or sell-off, price often pulls back — not because something is broken, but because markets breathe. That pause can offer opportunity. The challenge is understanding where it might pause, how strong that pause is, and what behavior happens in that zone.
Fibonacci retracement gives you those zones. It is based on ratios observed across nature and markets: 23.6%, 38.2%, 50%, 61.8%, and 78.6%. But these numbers mean nothing without context.
The real skill lies in learning to interpret how the market reacts around them.
The Key Levels Explained
Each level reflects a different type of pullback. Think of them not as fixed points, but as potential reaction zones — areas where the trend might breathe, strengthen, or fail.
- 23.6% — This is a shallow pullback. If price only retraces this far, it’s often a sign of strong momentum. Buyers aren’t waiting — they’re stepping in quickly.
- 38.2% — A moderate pullback. This is common in healthy trends. It allows enough of a reset without shaking confidence.
- 50% — This isn’t part of the Fibonacci sequence, but it’s widely used. It represents a psychological midpoint. A coin flip: continuation or reversal.
- 61.8% — Known as the golden ratio. If price holds here, the trend is still intact — but if it breaks, confidence often unravels.
- 78.6% — A deep retracement. It’s the last stand. If the trend holds, it shows strength. If not, expect a structural shift.
These levels alone do nothing. What matters is how price behaves around them — which brings us to how Fibonacci is actually used.
When to Use Fibonacci Retracement
You don’t use Fibonacci during a chaotic move. You use it after a clean swing — when one leg of movement is complete and the market has started to pull back.
That’s when the structure becomes visible. That’s when retracement zones can provide clarity.
Fibonacci is best used when:
- A trend is visible, but you're waiting for a correction before entering.
- You want to frame a possible entry, target, or stop — based on structure, not emotion.
- You're layering it with other tools: price memory, volume shifts, candlestick structure.
It is not a magic line that tells you when to buy. It is a lens. A way to organize your observation of what matters: reaction and behavior.
A Guided Walkthrough: Ava’s Trade
Let’s follow Ava — a disciplined swing trader.
One week, Ethereum rises from $2,000 to $3,000 in a strong uptrend. Ava doesn’t chase the move. She watches. And when price begins to stall at $3,000, she prepares.
She opens her chart and asks:
“Has the move completed?”
Yes — the rally is overextended and showing signs of hesitation. She selects the swing low ($2,000) and swing high ($3,000), and applies Fibonacci retracement.
Now, the chart reveals the levels:
- 23.6% at ~$2,765
- 38.2% at ~$2,618
- 50% at ~$2,500
- 61.8% at ~$2,382
- 78.6% at ~$2,236
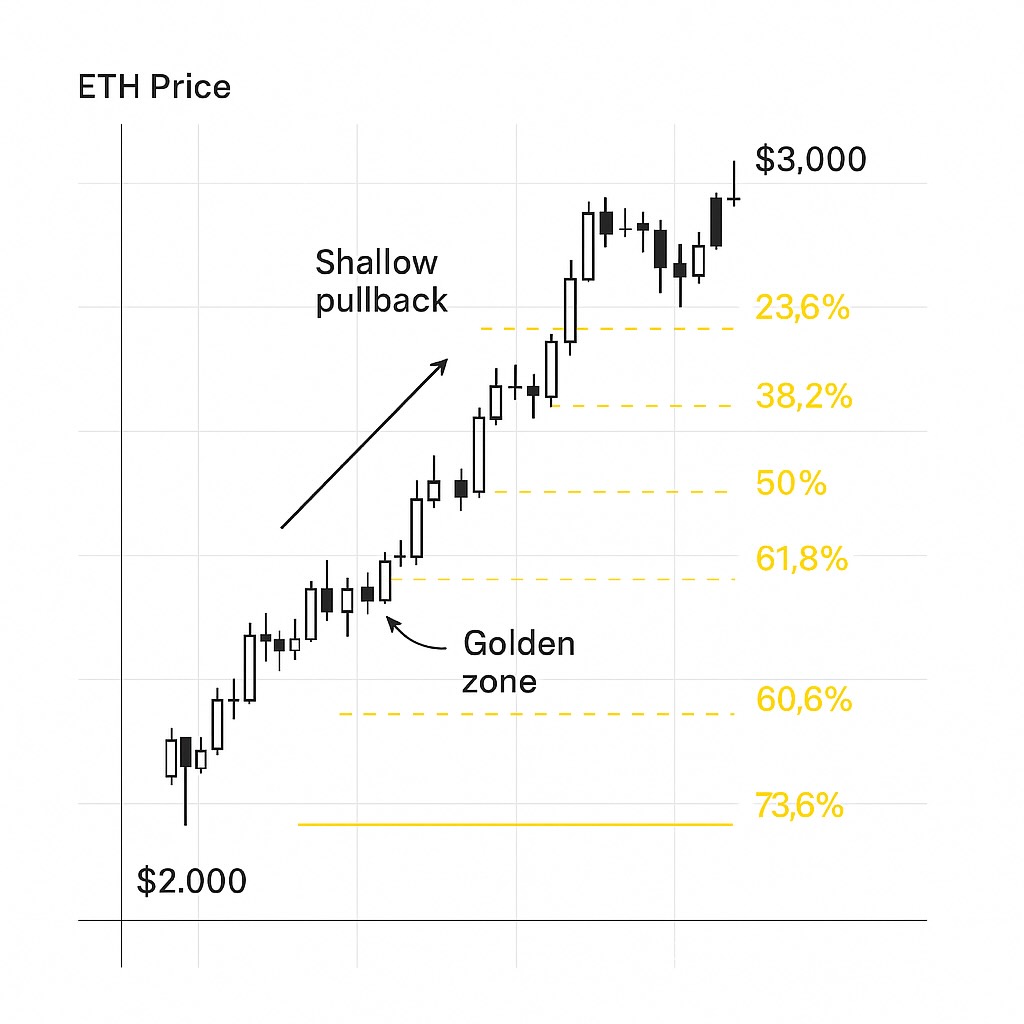
As price pulls back toward the 38.2% zone, Ava watches carefully:
- Volume increases — indicating interest from buyers.
- Candlestick structure tightens — smaller bodies, lower wicks.
- The level aligns with a previous resistance zone that may now act as support.
This confluence tells her that this level isn’t random — it’s being respected.
She waits for a confirmation candle: a strong bullish close off the level. When it appears, she enters the trade.
Her stop-loss goes just below the 50% retracement — giving the trade room to breathe. Her target? A retest of the prior high — and possibly more.
She didn’t act on instinct. She acted on structure + confirmation.
How to Read the Reactions
Anyone can draw Fibonacci lines. The real skill is learning what to look for around them.
Ask:
- Is price accelerating into the level — or slowing down?
- Are candles clean and impulsive — or indecisive?
- Is volume rising, falling, or flat?
- Is this zone lining up with other signals (e.g. moving averages, support zones, trendlines)?
If several factors agree — that’s confluence. That’s where structure becomes useful.
If price slices through the level with no hesitation — that tells you something too. It’s not a signal. It’s information. Respect it.
Ava’s Mental Model — What She Always Does
- Wait for the move to finish. Only use Fibonacci after a clean swing high/low.
- Apply the retracement. Low to high in uptrends, high to low in downtrends.
- Watch behavior. Don’t trade the level — trade the reaction.
- Look for confirmation. Candlestick structure, volume, or other signals.
- Plan with discipline. Set your stop and target based on the structure — not the feeling.
Kodex Perspective
Tools don’t replace thought. They sharpen it.
Fibonacci retracement is one way to turn hesitation into observation — and observation into structure. When used with awareness, it helps you avoid chasing, control risk, and think in levels, not guesses.
But don’t expect the lines to act alone. The strength is in how you read them — and how you combine them with other signals.
If price slices through every level? It may mean the pullback isn’t finished — or the trend is weakening. Either way, it’s not a signal to act. It’s a cue to wait.
In Kodex, we observe before we act. We frame before we forecast. And we don’t just draw structure — we move through it.
Let the chart speak.
Let your tools frame the conversation.
And let your judgment guide the decision.
Load a chart in the simulator that has just completed a clean swing and draw the retracement from swing low to swing high, exactly as Ava framed her Ethereum move. Then keep your hands off the keyboard at your chosen level and read the reaction: a confirmation candle with rising volume, or a clean slice straight through. Run it on a practice balance so a misread costs you nothing but the lesson that you trade the reaction, not the line.